Working with exceptions in Pry
If you're like me, you use the Rails console a lot. And by now I think everyone agrees that Pry is the best thing to happen to the Rails console since...well, ever.
Built-in to pry are a few really cool features that make it much easier to work with exceptions than it was in plain old IRB.
View the full backtrace
When exceptions happen in Pry (or IRB for that matter) you're presented with a shortened version of the backtrace. This is usually good enough, but not always.
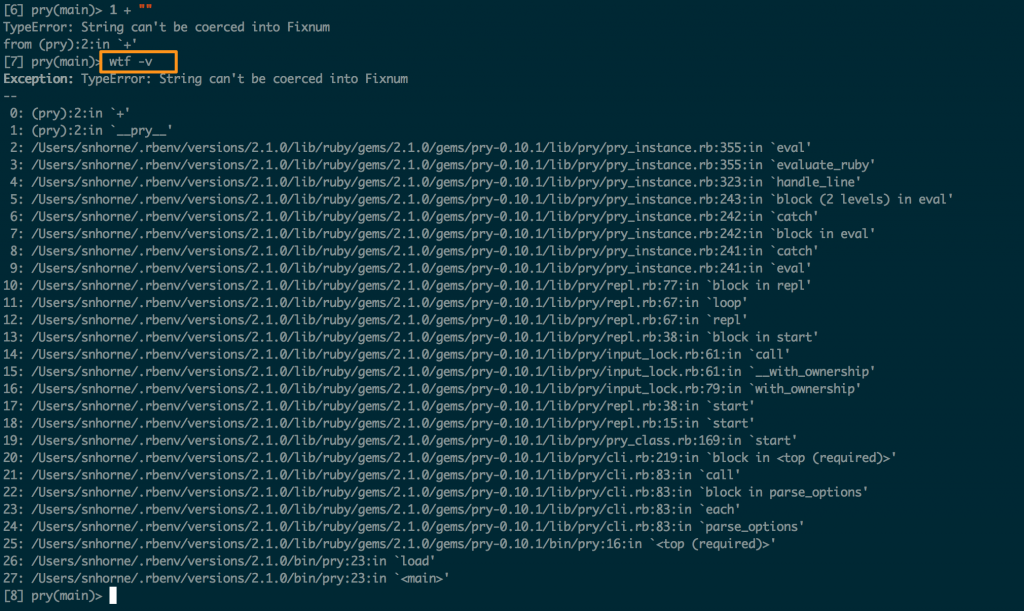
In pry you can see the full backtrace of the most recent exception by using the wtf -v command. If you leave off the -v flag, you get the abbreviated backtrace.
 Use the wtf command to access the most recent backtrace
Access exception data
Exceptions often have interesting data attached to them. When an exception happens in IRB you can only see the class name and error message. But with Pry you have access to the actual exception object. That means you can reach in and pull out whatever data you need.
To get the most recently raised exception, use the _ex_ variable. Unlike Ruby's built-in $! variable, you don't have to be inside of a rescue block to use it.
 Use the ex local variable to access the most recent exception
Customize how exceptions are displayed
Suppose you always want to see the full backtrace when you're in pry? You can do that by overriding the default exception handler.
Just open up ~/.pryrc and make it look like this:
# This code was mostly taken from the default exception handler.
# You can see it here: https://github.com/pry/pry/blob/master/lib/pry.rb

Pry.config.exception_handler = proc do |output, exception, _|
  if UserError === exception && SyntaxError === exception
      output.puts "SyntaxError: #{exception.message.sub(/.*syntax error, */m, '')}"
  else
    output.puts "#{exception.class}: #{exception.message}"
    output.puts "from #{exception.backtrace}"
  end
end
You could even do crazy stuff like log all of your Pry exceptions to Honeybadger. :)

Written by
Starr HorneStarr Horne is a Rubyist and former Chief JavaScripter at Honeybadger. When she's not fixing bugs, she enjoys making furniture with traditional hand-tools, reading history and brewing beer in her garage in Seattle.