First published Dec 16, 2020
Better stability with Rails load testing in Apache JMeter
Before we can release our software to end users, we must perform different kinds of tests to ensure that the application is bug-free and meets business requirements. When users begin using the application, various things can cause the application to behave unexpectedly, for some of the following reasons:
- User behavior can be unpredictable;
- Users are distributed across different locations;
- A large number of users could be using the application at the same time.
For large-scale applications, these things are crucial to know before a full-fledged release. A phased rollout can help us determine user behavior before everyone gets access to the release, but it's not going to tell us how the platform works under a high usage load. We can test how applications perform under load with the Rails load testing using Apache JMeter.
What is load testing, and how is it different from performance testing?
The following three terms may sound similar, but they are different:
- Performance testing
- Load testing
- Stress testing
Performance Testing is any general testing mechanism used to assess how the application performs with a given input. This could be done with a single user using the application or with multiple users. It is conducted to assess certain metrics, such as response time and CPU/memory usage. Load tests and stress tests are each a subset of performance tests.
Load Testing is conducted to ensure the application performs as expected with a specified number of concurrent requests, or users, using the application concurrently over a specified length of time. It helps in determining how many users a system can handle.
Stress Testing and load testing are closely related to each other. A stress test can be done with a similar mechanism as load testing, but the goal of testing is different. The goal of load testing is to determine whether our application works with the specified number of users, whereas a stress test is conducted to determine how the application behaves and handles failure after the load limit is hit.
Based on the ramp-up period, load tests can be categorized as either a spike test or a soak test. A sudden increase in users over a short length of time is a spike test, and a slow ramp-up of users over a longer duration is a soak test.
Why is load testing important?
On one of our Rails application projects, we were anticipating a lot of growth in users in the near future. We wanted to ensure that the application performed as expected, and crucial functionality was not lost with the increased number of users. So, how did we ensure this? We performed a load test and checked whether the application could handle the given increase in users, which led to us finding a bug in the app that appeared with higher usage rates. Some other cases that load testing can also help with include:
- If the application is expected to have a spike in users on a specific day, such as Black Friday, spike testing the application with a brief ramp-up period can help us find potential issues in the system.
- It allows us to evaluate how the platform's speed is impacted by an increased load. If the application is slow, we could lose customers.
- It helps to assess how our system works under an increased load and if the system crashes with high CPU or memory usage when there are 10,000 users.
In a similar scenario where we identified an issue, a hotel booking app had an open booking process, and when only a few users were trying to book a room, everything was fine. However, when multiple users were trying to book the same room, two different users were able to book it successfully. By load testing our app, we were able to identify the problem and fix it at an early stage, before releasing the feature.
Using Apache JMeter for Rails testing
JMeter is an Apache 2.0-licensed open-source Apache performance testing tool. It provides thread-based load testing, with which we can easily simulate the stress our system would be under when our application has a lot of concurrent requests. JMeter also provides good reporting of the test results.
We will look into how we can use Apache JMeter to perform load tests to identify potential issues with the system and the response time of our application by simulating a lot of users using our system.
JMeter can be downloaded from the official website
Some JMeter terminologies to be familiar with
- Test Plan is the top-level thing inside, which we define as the load testing components. Global configs and variables are defined here.
- Thread Group is used to define threads and configs, such as the numbers of threads, ramp-up periods, the delay between threads, and loops. This can be treated as the number of parallel users you want to run the performance test with.
- Sampler is what a single thread executes. There are different types of samplers, such as HTTP requests, SMTP requests, or TCP requests.
- Pre/Post Processor is used to execute something before or after the sampler runs. Post-processors can take in response data from one API call and pass it along for use on the next one.
- Listener listens to the response from the sampler and provides aggregated reports of the response time or response from each thread.
- Assertion can be useful to validate that the response data are what we expected from the sampler.
- Config Element defines configurations, such as the HTTP header, HTTP cookies, or CSV dataset configurations.
To run a load test, we need to first create a JMX file where we define the above-described JMeter terminologies.
Preparing a JMX file for a Rails load test
JMX is a JMeter project file written in XML format. Writing a JMX file manually can be difficult, so we will use the JMeter interface to create the file.
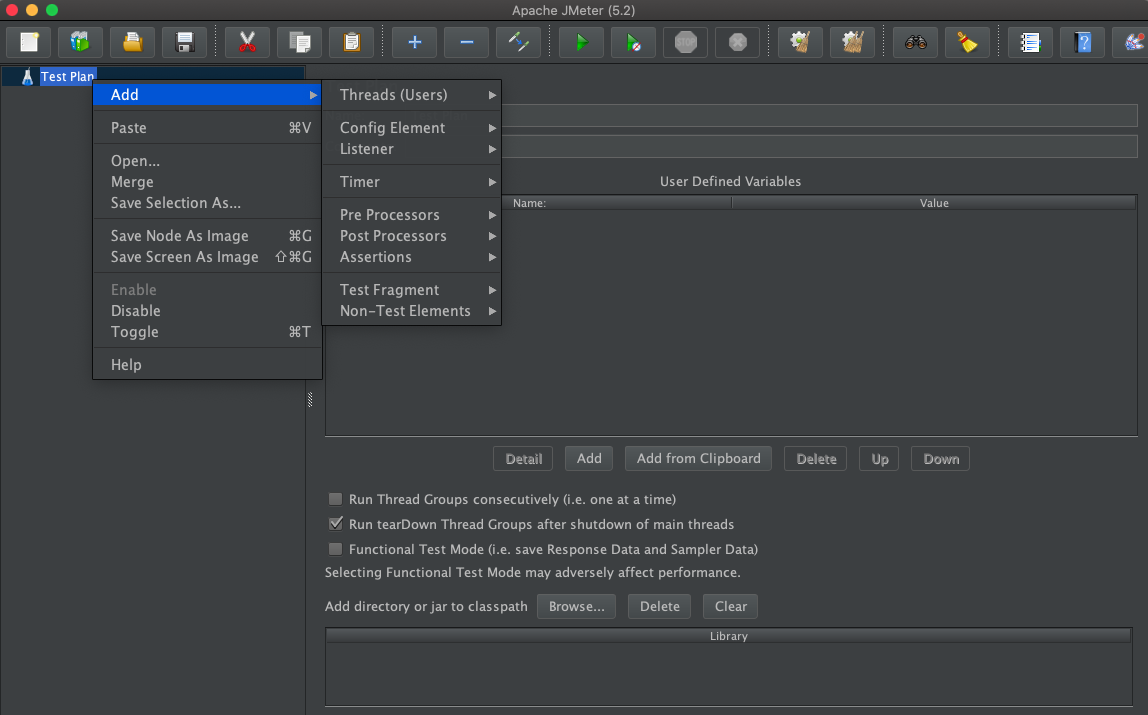
Open the JMeter interface and locate the test plan. Inside the test plan, we will add threads and its load test configurations.
 JMeter interface for creating test plans
The test plan can be renamed according to what we are load testing for. We can configure a thread group(Users). You can keep the default settings here and move on to create the threads group.
Add -> Threads(Users) -> Thread Group
In the thread group, by default, there will be a single thread specified. Change the number as needed to simulate the number of users accessing the app.
Since we will load test a web-based Rails application, we will add an HTTP sampler. We can add a sampler, which will be inside a ThreadGroup. Add an HTTP Sampler by navigating the following:
Add -> Sampler -> HTTP Request
Here, we configure the IP or the domain that we are load testing on and the HTTP method and any request body required for the HTTP endpoint.
Finally, to view the report of the load test, we can add a listener to the thread group.
Add -> Listener -> View Result Tree
The view result tree will display the response time of each thread. We can add other kinds of reports here as well. 'View result tree' should only be used for debugging proposes and not for actual testing.
In this way, we can create a simple test plan and execute it. Simply hit the play icon in the top bar of the JMeter to execute the test.
Things to consider before load testing a Rails application
The above example is a very simple, single-endpoint HTTP request. In the case of our Rails app, the endpoints we want to test are locked with authentication. Therefore, we need to ensure that we have the following things in place:
- Web cookie - The HTTP endpoints need to have a cookie header before we can perform the performance test on them. JMeter provides functionality to add the cookie once a user is logged in. In the next section, we will look into how we can record the browser request and convert it to a JMX file for our load test. We will also cover cookie recording.
- Rails CSRF token - Rails protects the app from security vulnerability by providing a CSRF token, so we need to ensure that our request has the CSRF authentication in the header before performing the load test. This CSRF token is present in the
headerinside ametatag in the HTML.
Rails CSRF Token can be fetched in JMeter by using a post-processor. Right-click on the HTTP Request that loads the web page containing the CSRF token, and then select Add -> Post Processor -> Regular Expression Extractor. Here, you can add the following regular expression extractor configs to read the CSRF value from the header meta tag:
-
Reference Name:
csrf_value -
Regular Expression:
name="csrfToken" content="(.+?)" -
Template:
$1$ -
Match No:
1
Now, the variable csrf_value can be used to make the request.
Recording requests from the browser to create a JMX file
With fewer HTTP endpoints, it can be simple to create a JMX file from the JMeter interface. However, for a larger test case, this can be difficult. Also, there is a chance we could miss actual requests made while a user uses the application. We want the actual requests made from the browser to be recorded and the JMX file created automatically.
JMeter can be added as a proxy between the Rails application and the browser. With this, all the requests will be forwarded to the Rails server by JMeter.
To create a recording in JMeter, go to file -> templates -> recording and click create, the specify the hostname you are recording. This will automatically generate a few things for you, including the cookie manager. The cookie manager will save the cookie required for authentication.
Verifying HTTPs requests with a JMeter SSL certificate
This request we make from the browser will be forwarded to JMeter, and JMeter will forward it to the web service and record the requests so that we can run the load test from the JMeter recording. If the application requires an HTTPS protocol for SSL connections, then a certificate needs to be added to the browser. To add the certificate, let us open Firefox or any other browser. In Firefox, Go to settings > Privacy > Manage certificate and add the JMeter certificate so that the browser will recognize the certificate generated by JMeter.
Enter cmd + sht + g and enter path /usr/local/Cellar/jmeter/5.2/libexec/bin/jmeter to add the certificate
Configure Firefox to use JMeter as a proxy
Next, we need to forward the request from Firefox to our JMeter recording script. This can be done by configuring the proxy in Firefox. Open Firefox and go to Preferences -> Advanced -> Connection(settings). Here, set the HTTP Proxy to "localhost" and the port to "8080" and check "Use this proxy server for all protocols".
Now, we can go to JMeter and the Script recording section from the template we chose earlier. Once we hit the start button, JMeter begins accepting the incoming requests. When we go to Firefox and browse the application we are load testing, this will record and convert it to a JMX file, which we can then run for our test.
Distributed load testing with JMeter
While running the test, we can perform a test from one of our local machines. Doing this is okay when preparing the test plan, but when running the actual test, we need to change it. Performing load tests on a single machine will have hardware limitations (i.e., CPU and memory) and request location limitations. These tests are run to simulate the traffic of actual users using the application. For this purpose, we need to distribute the tests to different servers and have a single place to view all the results.
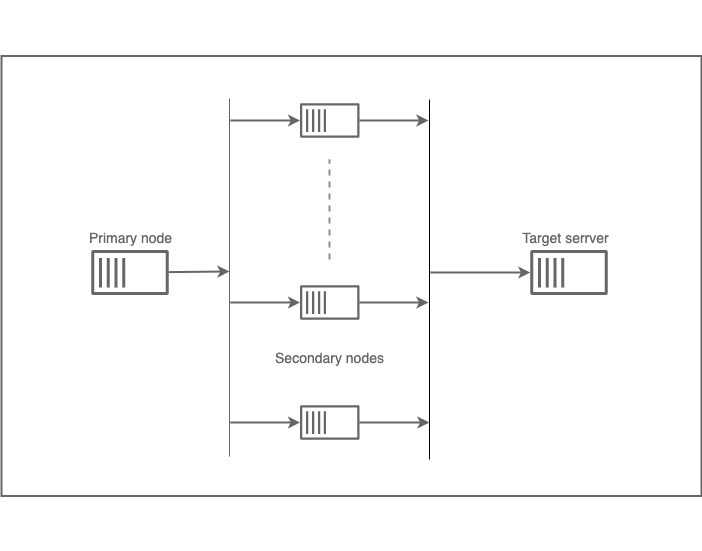
JMeter provides a primary node for orchestrating the test and multiple secondary nodes for running the test. This helps to simulate real users using the application. We can distribute the testing servers to different regions close to our actual users.
 JMeter Distributed testing
To perform a distributed test, begin by installing JMeter on both the primary and secondary servers.
Things to do on the secondary server:
- Go to
jmeter/binand execute thejmeter-servercommand. This will start the server to execute the test. - If any CSV input is needed for the test, add these files to this server.
Things to do on the primary server:
- Go to the jmeter/bin directory and open the
jmeter.propertiesfile. - Edit the line containing
remote_hostsand add the IPs of secondary servers, separated by commasremote_hosts=<s1_ip>,<s2_ip>. - Run the JMeter test.
The secondary server will be responsible for running the actual test, and the primary server will aggregate the reports.
To perform the load testing, we should always use the CLI command instead of triggering the test from the UI, as this can cause performance problems for the testing servers. We can use the JMeter command specifying the JMX filename:
> jmeter -n -t path/to/test.jxm -r
OR
> jmeter -n -t path/to/test.jxm -R s1_ip,s2_ip,…
-r uses the remote server specified in the jmeter.properties
-n will run it without the GUI mod
-t path to the jmx file
How we decided on using Puma vs. Unicorn for our Rails server
Puma and Unicorn are two different web servers for Rails. Both have benefits, so how do we decide which is best? It depends on the application. Some applications work best with Unicorn, and some work best with Puma. We had to choose between Unicorn and Puma for one of our Rails apps, and we did so based on data obtained from load testing. We performed a load test on the Rails app once with Unicorn and the other time using Puma. The only thing that we changed was the web server on the Rails app.
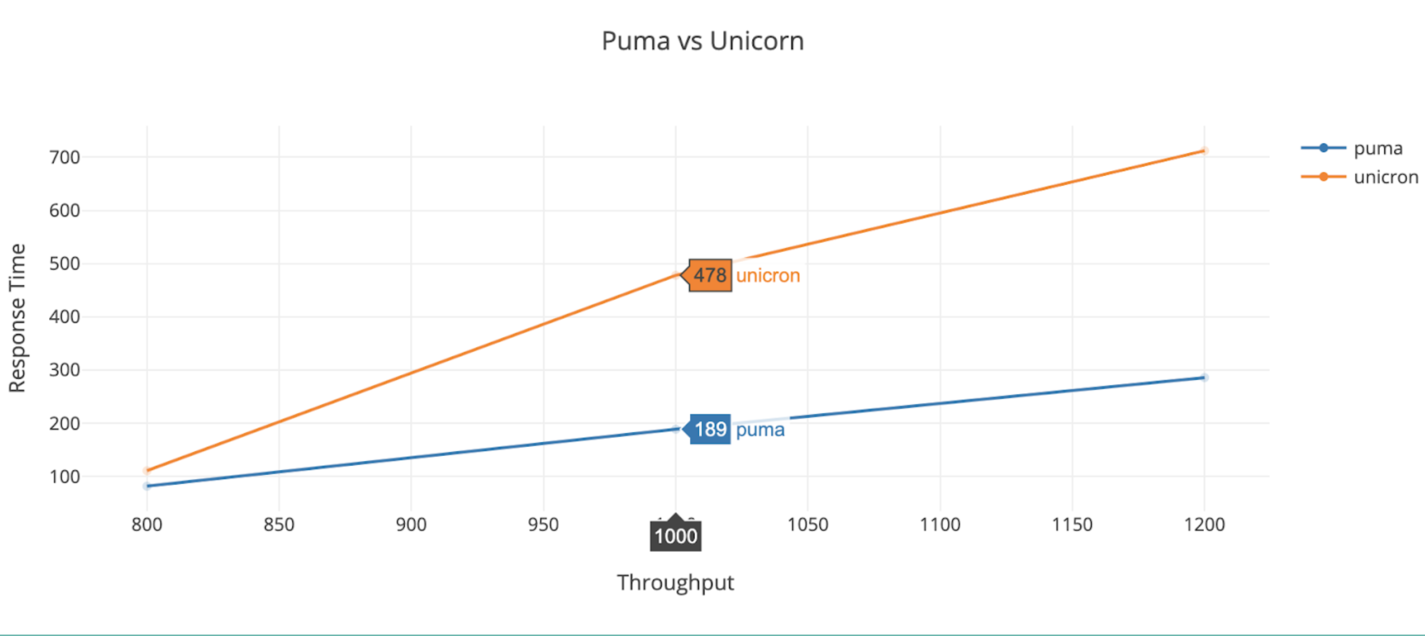
We got the following result from this test:
 Response time different between puma and unicorn
We found that Puma performs better for our Rails app when there is a large number of users on the platform. This means we will be able to handle more users with a smaller number of application servers.
Note: This depends on the type of server instance you are using and what kind of business logic processing the app performs.
Some common failures encountered while stressing a Rails application and how to remedy them
- Unoptimized database query
- Eliminate the n+1 query problem.
- Add an index according to the access pattern.
- Use a Redis-like caching layer in front of the database.
- Slow ruby code performance
- Memoize to optimize the code.
- Figure out the o(n^2) complexity and use optimal algorithms.
- In micro-service architectures, there can be a lot of HTTP calls between services. Network calls are slow.
- Reduce the number of HTTP calls by using a messaging system for microservices.
- The same record is created twice when created concurrently.
- Add a database-unique constraint.
- Utilize FIFO event(queue)-based resource creation.
- Use background processing, such as Sidekiq, whenever possible.
- Define an SLA for API response times and include performance testing as a part of the development lifecycle.
Which environment should be used to perform performance tests?
Rails testing in a production environment is not an ideal choice because it could cause issues and even downtime in production. We do not want to create problems in the production environment, but we still want to ensure that the test report reflects true data, similar to production. For a load or stress test, it is recommended to make a replica environment of production. This includes things like the following:
- The number of application servers.
- The database server's hardware specifications, including replicas.
- Production-like data in the testing database. This should include a nearly equal data volume as encountered in production.
Creating a production-like environment can be challenging and costly. So, based on what we are performance testing using JMeter, the infrastructure touching those components only can be upgraded to production-like. It saves cost. It is better to load/stress test your app once every three months. However, performance testing with a single user and validating that the response time is under the defined standard (something like 200m) is something that we need to add to the development cycle.
While Ruby load testing, we also need data points, such as CPU/memory usage of the target server. A spike in memory/CPU usage can cause the application to crash. To measure hardware KPIs, add monitoring tools, such as Prometheus, before starting the load test.
Apache JMeter is a powerful tool for load testing. We used Apache JMeter for testing Rails apps, but it can be used to perform load and stress tests of an application built on any stack. Load testing helps make data-powered decisions in the application. It can sound scary, but with a little investment in the beginning, load tests can add a lot of stability and reliability to your app in the long-term.

Written by
Milap NeupaneMilap is a Sr. Software engineer working with ruby/rails, Golang, and cloud-native technologies with AWS. He believes in the community and is the organizer of Golang Kathmandu. In his free time, Milap likes doing street photography.