Running Rails on a Kubernetes Cluster: Part 2
In part 1, we learned how to deploy a Rails application on a local Kubernetes cluster with Kind. In this post, we will delve deeper into other Kubernetes artifacts, such as services, Ingress, and the Horizontal Pod Autoscaler (HPA).
We will also wire it up with a subdomain so that we can see the app working on a public URL, which will be a subdomain for this tutorial. Let’s get going.
Prerequisites
To continue running our bands API rails app on a full-on production-ready Kubernetes cluster on DigitalOcean, the following are some prerequisites:
- Kubectl command is installed and working on your system.
- You are aware of how Kubernetes works and how it handles DNS and Ingress.
- You have some knowledge of how Kubernetes and Ingress work together.
- You know how to set up an A DNS record and map it to an IP address for the subdomain to work.
Next, we will get started with setting up a Kubernetes cluster on DigitalOcean.
Set up a Kubernetes cluster on DigitalOcean
To set up a Kubernetes cluster on DigitalOcean, log in to your account and click "Kubernetes" under Manage. You will see a screen like the one below:
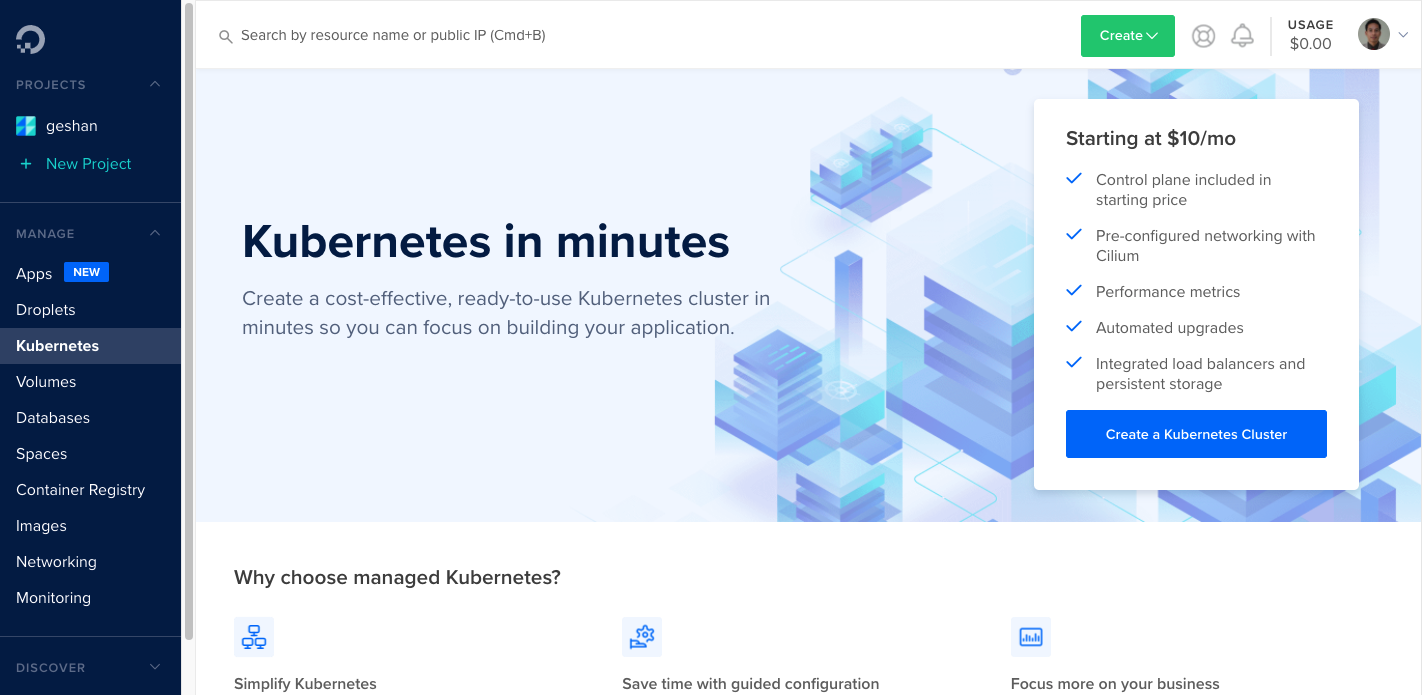
On the above screen, click the blue button that says “Create a Kubernetes Cluster”. Next, choose the data-center region:
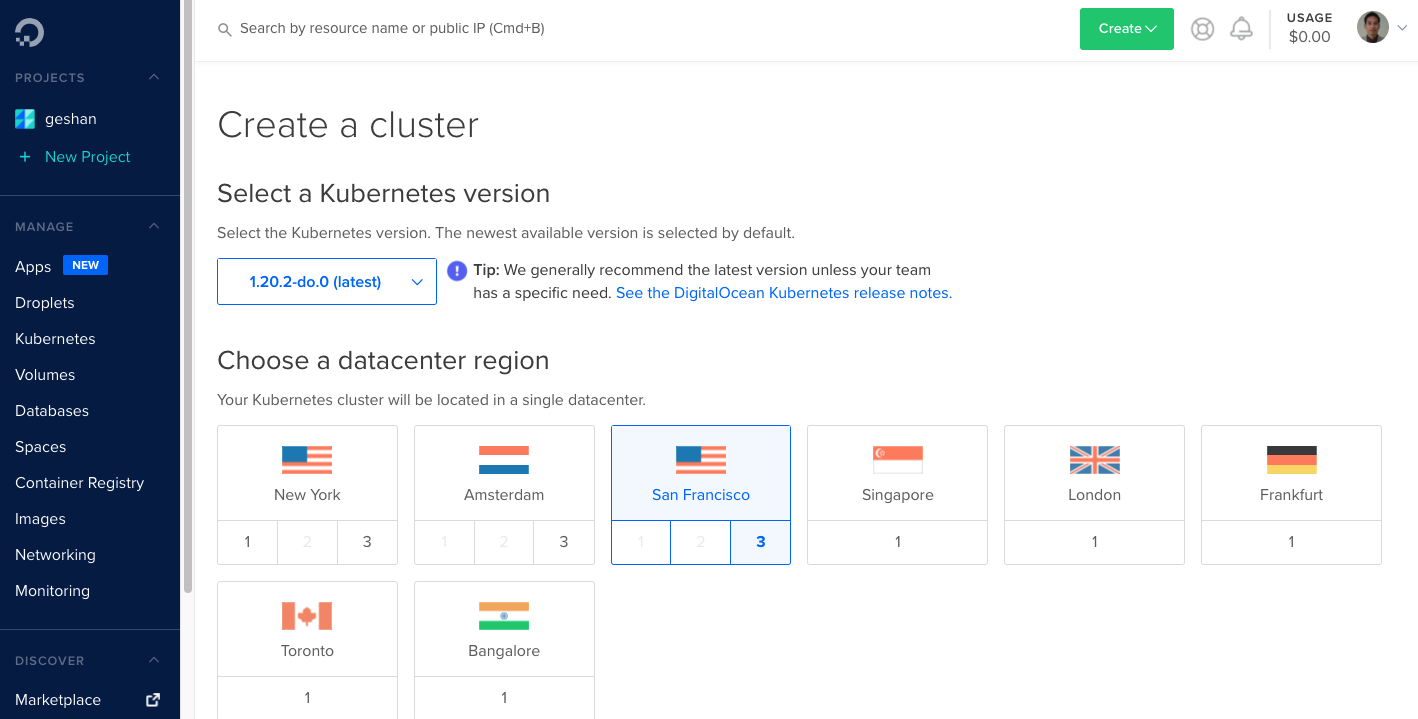
We choose "San Francisco" no. 3 and then opt to provision 3 nodes for the Kubernetes cluster. Each node has 1 GB of usable RAM (out of 2 GB) and has 2 vCPUs.
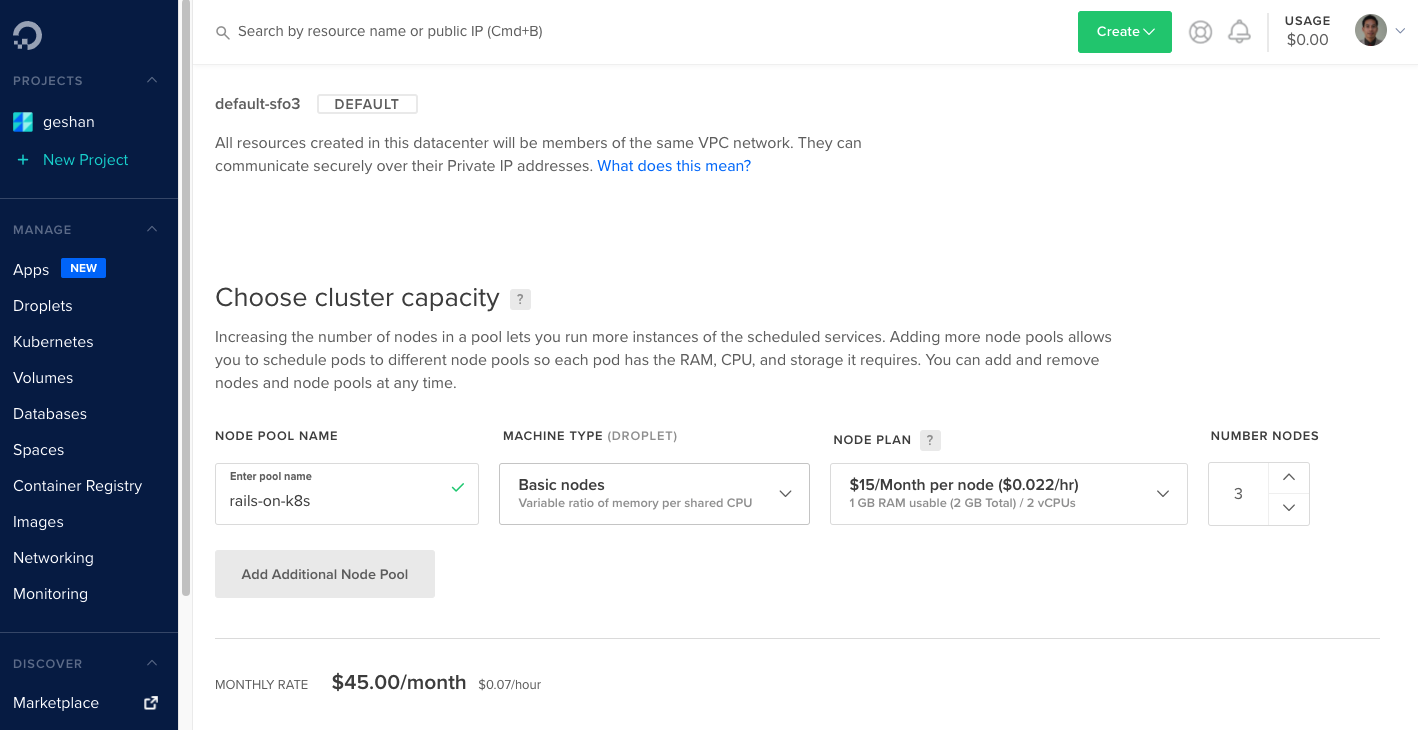
The monthly rate is $45 per month. Next, we will add tags and choose a name.
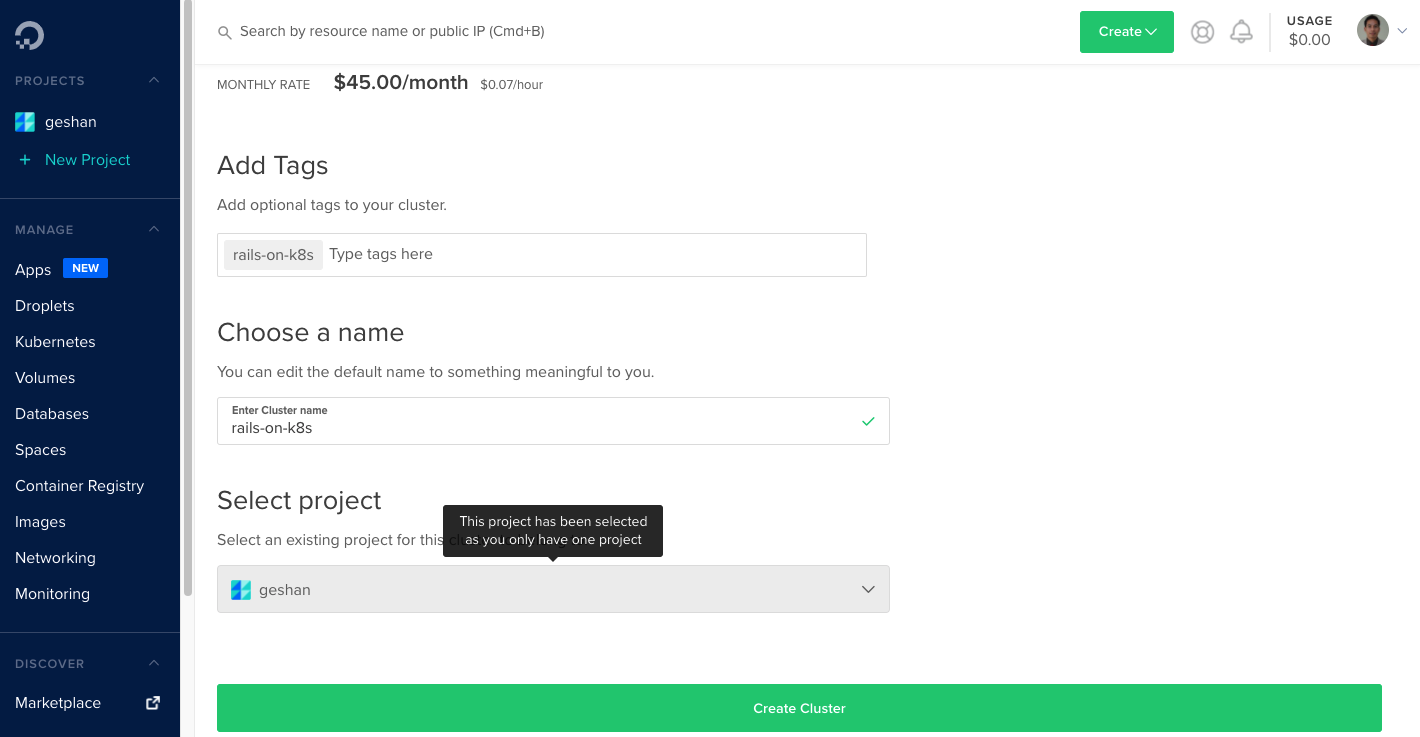
We chose to name the Kubernetes cluster rails-on-k8s and then click on the “Create Cluster” green button. It takes a couple of minutes, and the Kubernetes cluster is up and running, as shown below:
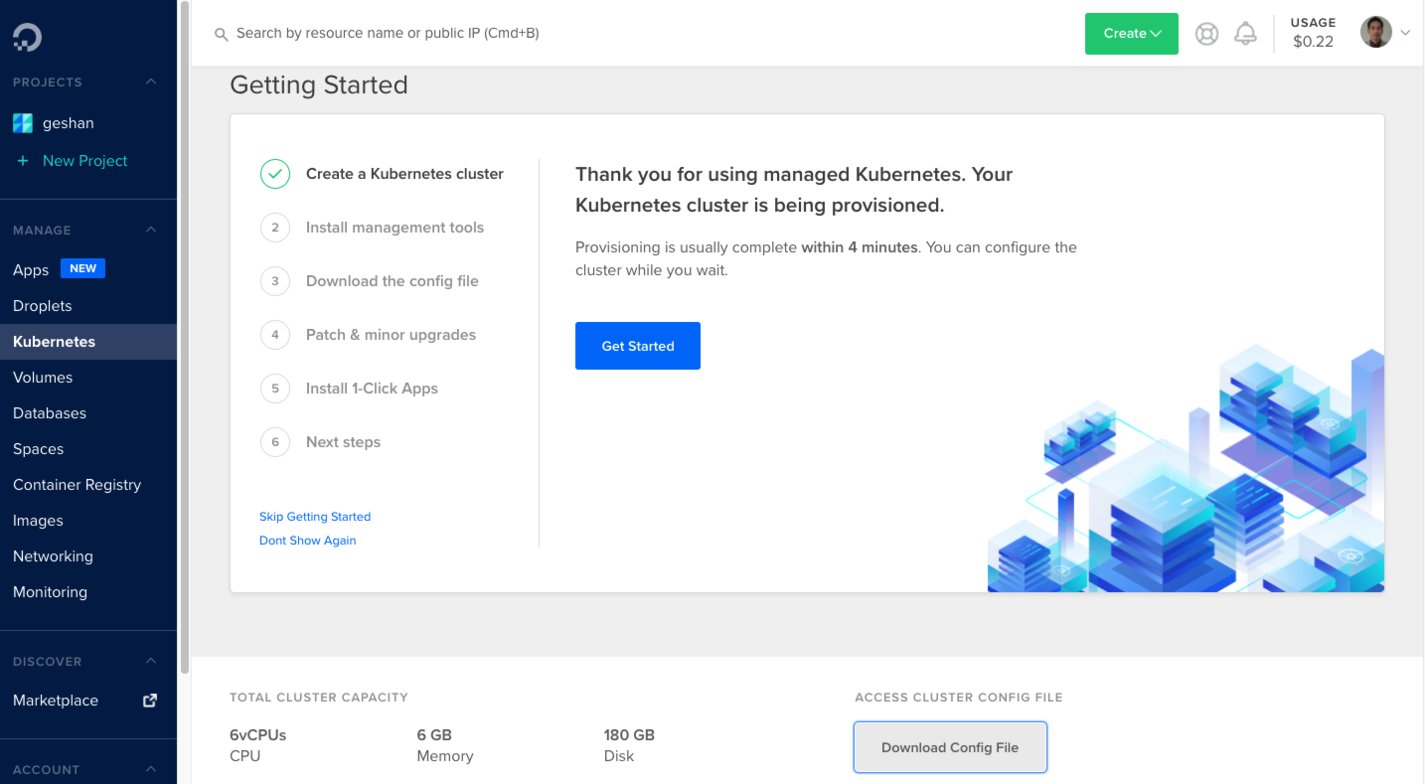
If desired, you can go through the steps, but the main thing to note is that you should “Download Config File” and put it into the ~/.kube folder. The config file is called rails-on-k8s-kubeconfig.yaml, and we should copy it to the ~/.kube folder. We need to be aware that it will take 2-4 minutes for the cluster to be up and running.
Subsequently, we can execute the following command to change the context for Kubectl command:
export KUBECONFIG=${KUBECONFIG:-~/.kube/config}:~/.kube/rails-on-k8s-kubeconfig.yaml
Next, we will use the following command to check whether the new cluster is available:
kubectl config get-contexts
Then, we switch the Kubectl context to the new cluster by running the following command:
kubectl config use-context do-sfo3-rails-on-k8s
Subsequently, to check whether the Kubectl context has switched correctly, we execute the following command to list nodes of the cluster:
kubectl get nodes
Then, output similar to the following will appear:

Now that we are sure our kubectl command is talking to our Kubernetes cluster on DigitalOcean, we will configure the NGINX Ingress controller. Ingress will help route the subdomain to the Bands API service we built with Rails.
Install NGINX Ingress
As Kubernetes’ official website defines it, Ingress exposes HTTP and HTTPS routes from outside the cluster to services within the cluster. So, it is like a router that can map the traffic from outside the cluster to services, deployments, and pods inside the cluster.
There are multiple flavors of Ingress controllers, and NGINX Ingress is one of the simplest. Per the official definition, NGINX Ingress is a controller for Kubernetes that uses NGINX as a reverse proxy and load balancer. To install the NGINX Ingress controller, run the following command:
kubectl apply -f https://raw.githubusercontent.com/kubernetes/ingress-nginx/controller-v0.45.0/deploy/static/provider/do/deploy.yaml
The following output is produced:
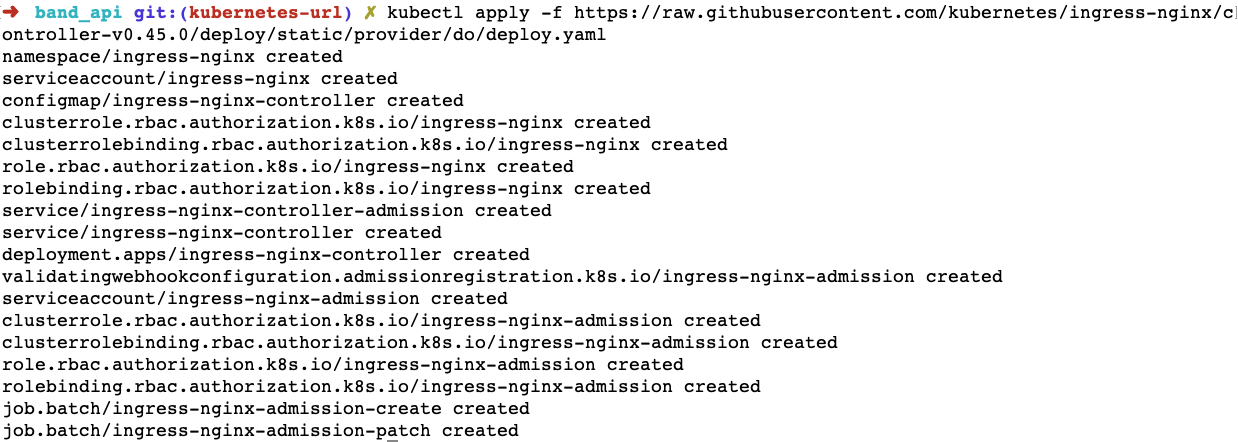
Now that the NGINX Ingress controller is installed and applied to our Kubernetes cluster, it can provide an external IP in our A name DNS record for the subdomain. To determine the external IP for the cluster, we run the following command after a couple of minutes:
kubectl get svc --namespace=ingress-nginx
This command will produce output similar to that shown below. Make note of the EXTERNAL-IP for the load balancer, as we will use it in the A Name DNS record for the subdomain.

To route traffic to the service from a subdomain, we will set up A name DNS records. To do so, we will use Cloudflare.
Add DNS records to route traffic to the cluster/service
In this tutorial, as an example, we will map the bands-api.geshan.com.np sub-domain to the bands-api service, which we will deploy later. To do this mapping, as the geshan.com.np website’s DNS is managed with Cloudflare, we will add the A DNS record on Cloudflare.
To add an A name DNS record with CloudFlare, log in to the Cloudflare account and perform the following steps:
- Click on the website after logging in.
- Click on "DNS" from the top menu
- Click "+ Add record" and fill up the details
- Type the letter A (in the select box), use the
bands-apiand IPv4 Address as the public IP address we noted asEXTERNAL-IPin the previous step. Make sure the Proxy Status isProxied, and click save as shown below:
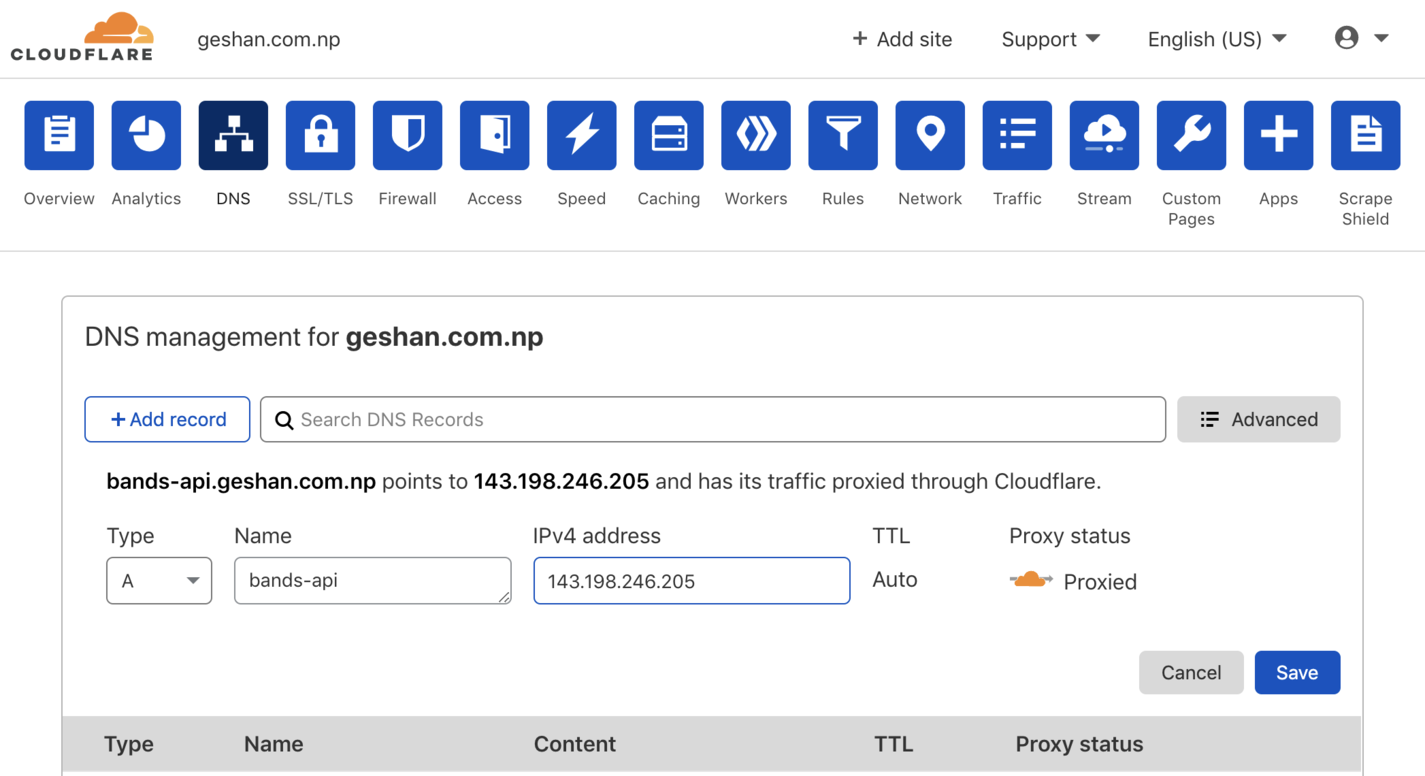
This will map the subdomain to the Kubernetes cluster’s public IP. If we hit the URL now, it will come back with a 404, as the service has not been set up with the correct Ingress controller at this point.
Another benefit of proxying the A name record with Cloudflare with proper settings is that we don’t need to set up SSL for the HTTPS connection. SSL can be set up with cert-manager in Kubernetes, which can use Let's Encrypt or other sources. For the sake of keeping this tutorial simple, we will not deal with explicit SSL certificate management. In the next step, we will install a metrics server in our Kubernetes cluster to support horizontal pod auto-scaling. Let's continue the magic.
Install a metrics server for horizontal pod auto-scaling
We want to be able to scale the number of pods based on some metrics. In our case, we will be using CPU usage. However, by default, our Kubernetes cluster does not obtain metrics for resources, such as CPU or memory, from the pods. This is where we will need to install Metrics Server.
According to the official definition of Metrics Server, it is a scalable, efficient source of container resource metrics for Kubernetes built-in auto-scaling pipelines. Furthermore,
Metrics Server collects resource metrics from Kubelets and exposes them in Kubernetes apiserver through Metrics API for use by Horizontal Pod Autoscaler and Vertical Pod Autoscaler. Metrics API can also be accessed by kubectl top, making it easier to debug autoscaling pipelines.
We are more interested in the Horizontal Pod Autoscaler (HPA) with metrics server capabilities. To install Metrics Server (version 0.4.2 at the time of writing this post), run the following command:
kubectl apply -f https://github.com/kubernetes-sigs/metrics-server/releases/download/v0.4.2/components.yaml
The command should produce output similar to the following:

Great! We have our metrics server running on our Kubernetes cluster. To determine whether it is working properly, run the command shown below after a couple of minutes:
kubectl top nodes
It will show the CPU and memory resource usage of our Kubernetes nodes.
An important point to note here is how often these metrics are being scraped. The default setting is every 60 seconds. Therefore, if our app experiences a very high load for just 55 seconds, it will not scale up, which is not optimal for the test case of this tutorial. To change the metric-resolution from the default 60 seconds to 20 seconds, do the following:
- Click on “Kubernetes Dashboard” provided on the cluster’s page on DigitalOcean.
- Go to “Deployments” under Workloads and find
metrics-server. - Click the 3 dots and click
edit. - Find
- '--kubelet-use-node-status-port'and add- '--metric-resolution=20s'and selectUpdate, as follows:
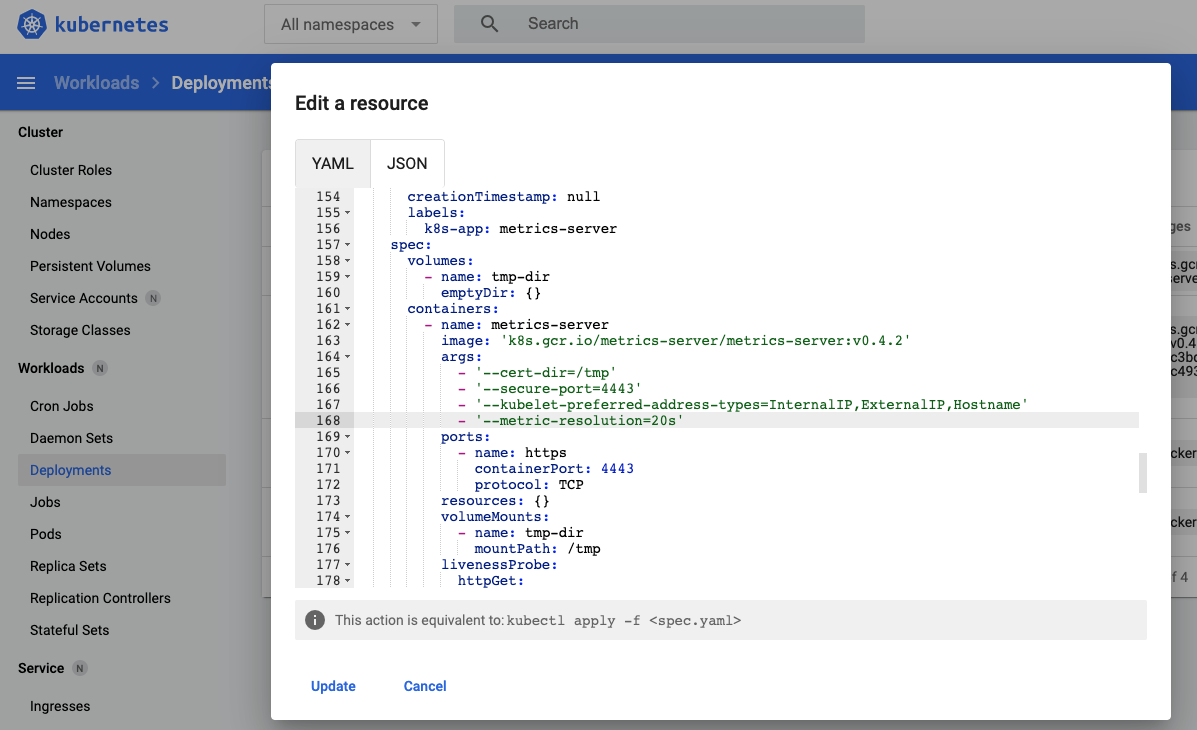
Make sure the metrics-server deployment is green after a minute or run kubectl top nodes again to make sure things are working properly.
Update code to be production-ready
At this point, we have our Kubernetes cluster setup with NGINX Ingress controller and the metrics server running with 20s metrics resolution. Next, we will change the Kubernetes artifacts to be production-ready.
Add the health-check route
The first thing we will add is a health-check path with a health-check controller so that our deployments have a new readiness probe. To do this, complete the following steps:
- Run docker-compose to get the container running.
- Go inside the web container with
docker-compose exec web /bin/bash. - Run
rails generate controller HealthCheck healthcheckto generate a new health-check controller with the health-check action:

We will edit the new health-check controller accessible at /health_check/healthcheck, as shown below:
class HealthCheckController < ApplicationController
  def healthcheck
    output = {'message' => 'alive'}.to_json
    render :json => output
  end
end
It gives a JSON {“message”: “alive”} as a health-check test. Next, we will use it in the deployment’s readiness-probe check. The changes made to add the health-check route can be seen in this pull request.
Include health-check route in deployment
At this point, it is beneficial for us to be aware of the difference between liveness and readiness probes for Kubernetes pods. We will add the readiness probe to the ./k8s/deployment.yaml:
apiVersion: apps/v1
kind: Deployment
metadata:
  labels:
    app.kubernetes.io/name: bands-api
    process: web
  name: bands-api-web
spec:
  selector:
    matchLabels:
      app.kubernetes.io/name: bands-api
      process: web
  template:
    metadata:
      labels:
        app.kubernetes.io/name: bands-api
        process: web
    spec:
      containers:
      - env:
        - name: PORT
          value: "3000"
        envFrom:
        - configMapRef:
            name: bands-api
        image: docker.io/geshan/band-api:latest
        imagePullPolicy: IfNotPresent
        name: bands-api-web
        ports:
        - containerPort: 3000
          name: http
          protocol: TCP
        readinessProbe:
          httpGet:
            path: /health_check/healthcheck
            port: 3000
          initialDelaySeconds: 10
          periodSeconds: 10
          timeoutSeconds: 2
        resources:
          limits:
            cpu: "200m"
            memory: "128Mi"
          requests:
            cpu: "150m"
            memory: "128Mi"
      restartPolicy: Always
In addition to changing the health-check URL, we have also added a resources section that will limit the CPU usage used for the auto-scaling settings used later. Next, we will add the service file.
Service file
Deployment and services in Kubernetes might seem similar, but they are different. Deployment is responsible for keeping a set of pods running, whereas a service is responsible for enabling network access to a set of pods. We will use the following service definition at ./k8s/service.yaml:
apiVersion: v1
kind: Service
metadata:
  name: bands-api
spec:
  ports:
  - port: 80
    targetPort: 3000
  selector:
    app.kubernetes.io/name: bands-api
    process: web
It is a very simple service definition stating that the service runs on port 80 and maps to the target port of 3000 on the pods. The pods can be selected with name bands-api and process web, which leads to the bands-api deployment labels.
In the next step, we will add the Ingress controller, which is a bridge for the subdomain traffic to reach the correct service.
Add the Ingress file
As discussed earlier, a NGINX Ingress controller helps us get the traffic from outside the Kubernetes cluster to the right services; it is like an intelligent router. Our NGINX Ingress controller Kubernetes artifact looks like the code shown below and can be found at ./k8s/ingress.yaml:
apiVersion: networking.k8s.io/v1beta1
kind: Ingress
metadata:
  name: bands-api-ingress
spec:
  rules:
  - host: bands-api.geshan.com.np
    http:
      paths:
      - backend:
          serviceName: bands-api
          servicePort: 80
This is also a simple Ingress that says the host bands-api.geshan.com.np should be routed to the bands-api service at port 80 of the service. Below is an over-simplified illustration of how traffic is routed to pods via the Ingress service.
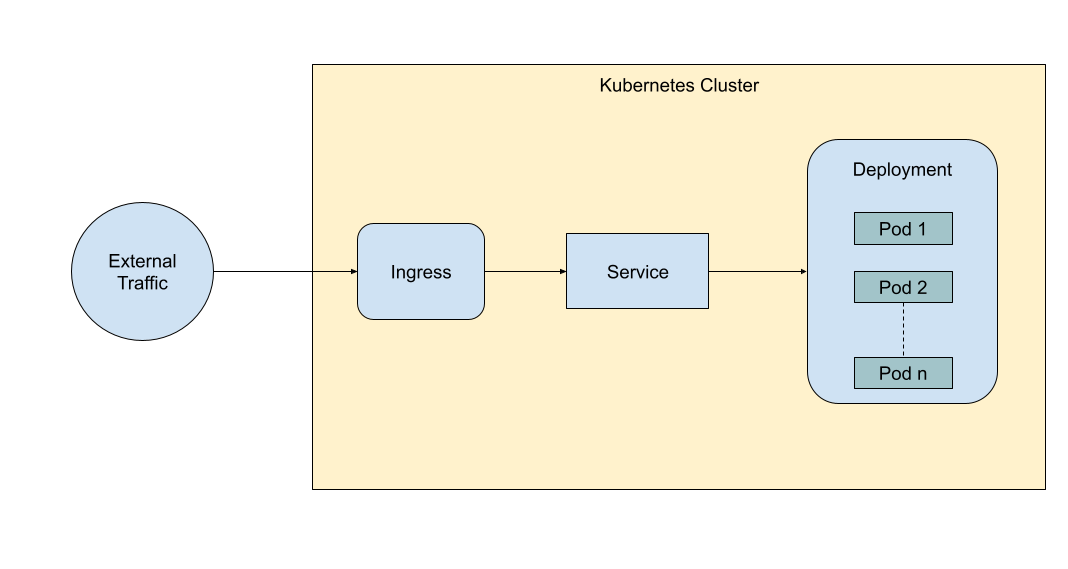
Next, we will write the Horizontal Pod Autoscaler, which is an important part of this tutorial.
Add Horizontal Pod Autoscaler YAML
In this section, we will add the Horizontal Pod Autoscaler Kubernetes artifact. Also called HPA, it automatically scales the number of pods in other Kubernetes artifacts, such as deployment and the replica set, per the observed CPU usage or other metrics. In conjunction with the metrics server, if CPU usage goes above a threshold for a certain amount of time, HPA will add a Pod until the max replicas limit is reached. Below is our definition of the Horizontal Pod Autoscaler:
apiVersion: autoscaling/v2beta1
kind: HorizontalPodAutoscaler
metadata:
  name: bands-api-web
spec:
  scaleTargetRef:
    apiVersion: apps/v1
    kind: Deployment
    name: bands-api-web
  minReplicas: 2
  maxReplicas: 5
  metrics:
  - type: Resource
    resource:
      name: cpu
      targetAverageUtilization: 10
Notably, in the above HPA YAML definition, we are scaling the deployment named bands-api-web from a minimum of 2 to a maximum of 5 pods. It is set to a minimum of pods 2 to have minimal to no downtime; if there is a 1-pod minimum, there could be more downtime.
The metrics under consideration is CPU, if CPU average utilization is above 10 percent (for 20 seconds, as per our metrics server’s metric resolution frequency), HPA will spring into action to add pods.
All these changes made to add Kubernetes resources can be seen in this pull request. It includes the deployment changes and the addition of the HPA for autoscaling, Ingress for routing, and Service for mapping traffic to the deployment.
Apply the new changes with Kubectl
To apply these new Kubernetes-related changes, we will run the following command at the root of the project:
kubecl apply -f ./.k8s
It will give us an output like below:

After a couple of minutes, the pod should be up, and we can hit our URL in the browser to see the output. You can also do a quick check with kubectl get po to check whether there are 2 pods for the bands-api deployment before proceeding.
Test whether bands API is running on the subdomain
To test whether the service is running on our subdomain, which is bands-api.geshan.com.np in this case, we can try to load the URL in the browser of our choice.
If all the above steps went well, we should to see something like the output shown below for the health-check URL:

Consequently, we will test if the API route to show all bands is working at /api/v1/bands. It should yield the following output:
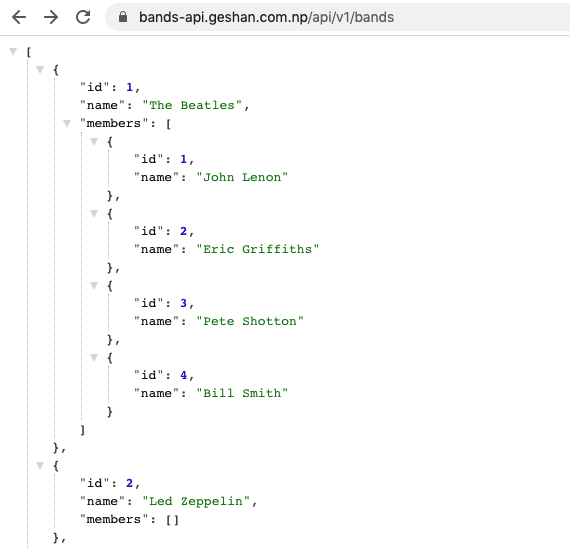
Testing Horizontal Pod Autoscaler (HPA)
Since the API is functional at this point, we will test whether auto-scaling works as intended with the Horizontal Pod Autoscaler. To see this action, we will send some traffic to the service with Vegeta load testing and see how it responds.
Send traffic with Vegeta
To send some traffic with the Vegeta load testing tool, we will run the following command:
echo "GET https://bands-api.geshan.com.np/api/v1/bands" | vegeta attack -duration=30s -rate=5 | vegeta report --type=text
Of course, to run this, you will need Vegeta running on your local machine. We can even do it with a Dockrized Vegeta. The command is sending 5 requests per second to our Band API service for 30 seconds and producing a report in text format, which looks something like the following:

While the service is being hit with 5 requests per second for 30 seconds, which equates to a total of 150 requests, we can see if the is HPA working as intended. In theory, the HPA should have kicked into action at around the 20-second mark, which we can verify by running the following command:
kubectl get po --watch
The above command shows all the pods running on the cluster and watches it for changes. Similarly, we can also check whether the HPA has sprung into action with the following command:
kubectl get hpa
We might need to run it multiple times to see how much CPU usage is going up as the service is getting requests. We can see how it looked when the URL was being hit by 5 RPS for 30 seconds below:
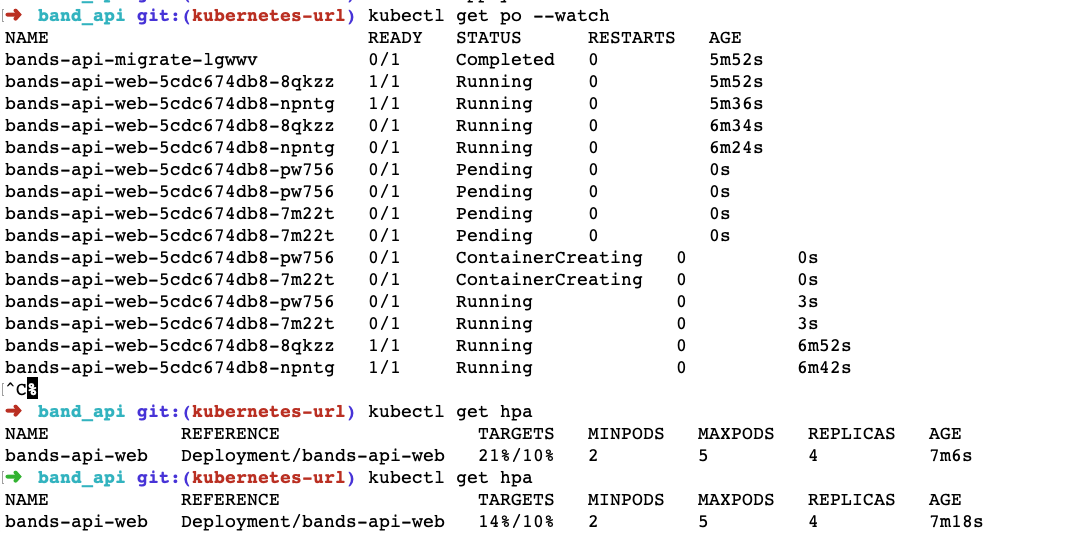
When the requests were flowing, CPU usage for the pods jumped to 21%, which was higher than the threshold of 10%. This resulted in HPA scaling up the pods from 2 to 4. The pods took a bit of time to come up, but they did come up eventually.
After the load test finished, we ran kubectl get hpa again to find that the CPU usage came down to 0 or 1%, and when we ran kubctl get po at that time, it scaled the number of pods down back to 2, which is the minimum number specified in the HPA.

At this juncture, we can safely say that the HPA did its job very well. It scaled up the number of pods when being hit with traffic and scaled down the pods when the traffic slowed.
You can find the application on GitHub to scrutinize any changes.
Conclusion
In this post, we have explained how to deploy an auto-scaling Rails API app on Kubernetes.
In the process, we also explored the relationship between seemingly complex and overlapping concepts of Deployment and Service.
We also saw how the NGINX Ingress controller helps map a domain or subdomain to services inside the Kubernetes cluster. Finally, we defined and saw the Horizontal Pod Autoscaler (HPA) swing into full action when hit by load-testing traffic using Vegeta.
I hope that you enjoyed reading the second installment of the Rails on Kubernetes series and that it helped you gain a better understanding of Kubernetes artifacts.

Written by
Geshan ManandharGeshan is a seasoned software engineer, with more than a 14 years of software engineering experience. Currently, in Sydney, Australia serving THE ICONIC as a lead software engineer. He has a keen interest in REST architecture, microservices and cloud computing. He is a language agnostic software engineer who believes the value provided to the business is more important than the choice of language or framework.