Bugs are annoying. They are by far the most time-consuming part of any software development project, and despite what any developer could desire, there's no way to eliminate them for good.
What you can do as a developer is leverage existing tools and methodologies that help reduce the time devoted to hunting down and fixing them.
Unfortunately for PHP developers, the language's built-in tools are mediocre, and this is probably an overstatement. Think var_dump, print_r, and the dynamic duo of dump and die.
In this article, you'll learn exactly what a debugger is, what options you have within the PHP ecosystem, and how to install and use one.
Let's get started.
What is a Debugger
A debugger, in general, is a tool that helps to find the causes of bugs. in particular, every tool has its own feature set, but its purpose is always to perform debugging.
Don't get confused; a Debugger won't fix problems for you (yet), but it'll certainly help you pinpoint the issues.
Before we dig any deeper, let's quickly review the tools you have out of the box:
- Error messages
- Log files
These are certainly very important, but don’t tend to be very informative. More importantly, you only get information after the script has completely executed, which makes it difficult to get the context of what was happening when the error occurred. This means that you have to re-create the dynamic flow of the program in your head.
A debugger will allow you to see the contents of variables while the program is running rather than after the last line has run.
Another great advantage of using a tool like this is the ability to inspect runtime values without adding code.
I want to stress this last point, as many developers don't consider it to be very important. It's not uncommon that in the heat of battle, you put a debugging message that the end users are not supposed to see, such as the following:
<?php

if ($var === INVALID_VALUE) {
    echo 'Arrrrrrrrgghhh!!! $var = INVALID_VALUE! Oh god why oh why???';
}
Then, after hours of thoroughly examining the code, you finally understand it, fix it, and call it a day. However, when demo time comes, you find yourself with a screen like this:
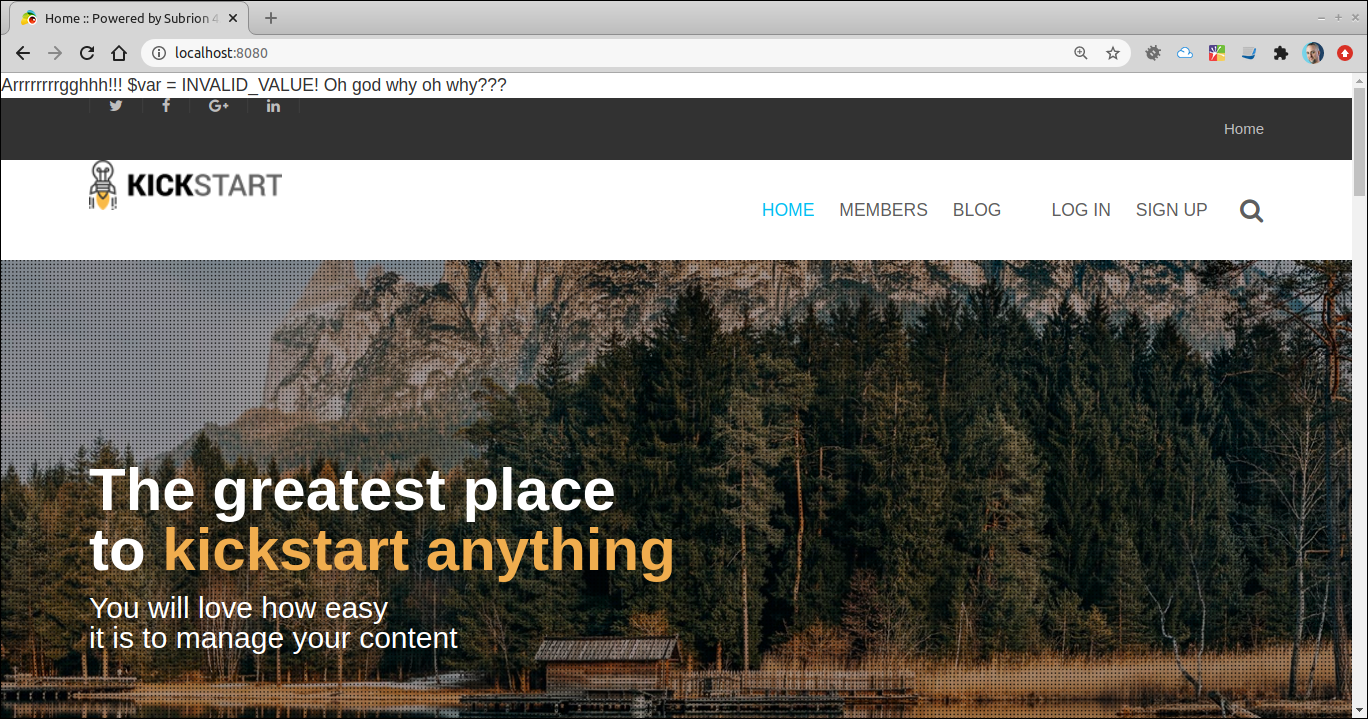
Or much worse...
I hope you realize now that the ability to see what's going on without tampering with your code is extremely valuable.
In practical terms, a debugger is a plugin or addon for an integrated development environment (IDE). In the case of PHP, it's a little trickier since PHP is an interpreted language, which usually runs on top of a web server. Basically, there are two pieces to every PHP debugger: a server (the debugger itself) and a client (the IDE).
Available Debuggers for PHP
There are a few serious contestants in the PHP debug landscape:
PHPDbg
PHPDbg is an interactive php interpreter with built-in debugging capabilities. Since version 5.6, it has been bundled with every PHP installation. It could come in handy in a situation where you don't have access to a proper graphical editor, such as a remote server.
To get it started, all you need to do is issue a command like the following:
phpdbg -e /path/to/your/php/script
Will which show you a prompt like this:
[Welcome to phpdbg, the interactive PHP debugger, v8.0.12]
To get help using phpdbg type "help" and press enter
[Please report bugs to <http://bugs.php.net/report.php>]
[Successful compilation of /path/to/your/php/script]
prompt>
From there, you can step through your program, set breakpoints, etc. For instance, let’s say you have a php script that looks like this:
<?php

try {
    $conn = new PDO('sqlite:dt.sq3');
} catch (PDOException $exception) {
    die($exception->getMessage());
}

$sql = "SELECT * FROM products";
$st = $conn
    ->query($sql);

if ($st) {
    $rs = $st->fetchAll(PDO::FETCH_FUNC, fn($id, $name, $price) => [$id, $name, $price] );

    echo json_encode([
        'data' => $rs,
    ]);
} else {
    var_dump($conn->errorInfo());
    die;
}
And you want to see the contents of $rs before the json encoding takes place. You could start the debugging session with this command:
phpdbg -e get_data.php
Then, place a breakpoint on line 14:
prompt> b 14
[Breakpoint #0 added at get_data.php:14]
Next, have the script run to that point using this command:
prompt> run
[Breakpoint #0 at get_data.php:14, hits: 1]
>00014:     $rs = $st->fetchAll(PDO::FETCH_FUNC, fn($id, $name, $price) => [$id, $name, $price] );
 00015:
 00016:     echo json_encode([
Take one further step:
prompt> step
[L14      0x7fa306058d80 INIT_METHOD_CALL<2>     $st                  "fetchAll"                                get_data.php]
[L14      0x7fa306058da0 SEND_VAL_EX             10                   1                                         get_data.php]
[L14      0x7fa306058dc0 DECLARE_LAMBDA_FUNCTION<64> "\000{closure}/hom"+                      ~7                   get_data.php]
[L14      0x7fa306058de0 SEND_VAL_EX             ~7                   2                                         get_data.php]
[L14      0x7fa306058e00 EXT_FCALL_BEGIN                                                                        get_data.php]
[L14      0x7fa306058e20 DO_FCALL                                                          @8                   get_data.php]
[L14      0x7fa306092060 EXT_STMT                                                                               get_data.php]
[L14      0x7fa306092080 INIT_ARRAY<12>          $id                  NEXT                 ~0                   get_data.php]
[L14      0x7fa3060920a0 ADD_ARRAY_ELEMENT       $name                NEXT                 ~0                   get_data.php]
[L14      0x7fa3060920c0 ADD_ARRAY_ELEMENT       $price               NEXT                 ~0                   get_data.php]
[L14      0x7fa3060920e0 RETURN                  ~0                                                             get_data.php]
[L14      0x7fa306092060 EXT_STMT                                                                               get_data.php]
[L14      0x7fa306092080 INIT_ARRAY<12>          $id                  NEXT                 ~0                   get_data.php]
[L14      0x7fa3060920a0 ADD_ARRAY_ELEMENT       $name                NEXT                 ~0                   get_data.php]
[L14      0x7fa3060920c0 ADD_ARRAY_ELEMENT       $price               NEXT                 ~0                   get_data.php]
[L14      0x7fa3060920e0 RETURN                  ~0                                                             get_data.php]
[L14      0x7fa306092060 EXT_STMT                                                                               get_data.php]
[L14      0x7fa306092080 INIT_ARRAY<12>          $id                  NEXT                 ~0                   get_data.php]
[L14      0x7fa3060920a0 ADD_ARRAY_ELEMENT       $name                NEXT                 ~0                   get_data.php]
[L14      0x7fa3060920c0 ADD_ARRAY_ELEMENT       $price               NEXT                 ~0                   get_data.php]
[L14      0x7fa3060920e0 RETURN                  ~0                                                             get_data.php]
[L14      0x7fa306058e40 EXT_FCALL_END                                                                          get_data.php]
[L14      0x7fa306058e60 ASSIGN                  $rs                  @8                                        get_data.php]
[L16      0x7fa306058e80 EXT_STMT                                                                               get_data.php]
>00016:     echo json_encode([
 00017:         'data' => $rs,
 00018:     ]);
Then, evaluate the result for yourself:
prompt> ev $rs
Array
(
    [0] => Array
        (
            [0] => 1
            [1] => Chair
            [2] => 20.0
        )

    [1] => Array
        (
            [0] => 2
            [1] => Shoe
            [2] => 1.0
        )

    [2] => Array
        (
            [0] => 3
            [1] => Candle
            [2] => 0.75
        )

)
This is certainly nice, but not very practical if you ask me.
ZendDebugger
The second tool I want to tell you about today is ZendDebugger. ZendDebugger is a PHP extension designed to be used in conjunction with ZendStudio, an IDE developed and maintained by Zend.
ZendStudio is a commercial product based on Eclipse PDT.
On the plus side, it has the support of Zend, the company behind PHP, so chances are that if you work with their products, you'll be able to opt for good and timely support. However, it being a commercial product means you can run into licensing issues.
As for the specifics of ZendDebugger, it can be used outside ZendStudio, and it can work well, but it's intended use is as part of the Zend package.
XDebug
Last, but definitely not least, is XDebug. XDebug is also a PHP extension that has to be installed on the development server to enable debugging capabilities. It was created, and is maintained to this day, by Derick Rethans.
The main criticism of XDebug used to be it's cumbersome installation and configuration process. However, since version 3.0, that's all in the past, as you'll see in the following sections.
How to Install XDebug
XDebug's installation is, of course, dependent on your particular platform. However, despite its differences, it's pretty straight forward. If you're using some flavor of Ubuntu or similar, all it takes is for you to run the following
sudo apt-get install php-xdebug
If you don't have the opportunity to use a package manager, you can still install it easily via PECL:
pecl install xdebug
Alternatively, you can get the source code directly from Git and compile it yourself:
git clone git://github.com/xdebug/xdebug.git
If you want to take this road, at least have this on hand. Believe it or not, this was the only way to get it done not so long ago.
Once the binaries are in place, you need to enable xdebug through the php.ini file. The exact file you need to change depends on your particular configuration. There might a single giant php.ini or one for each extension available.
If you don't know which one to choose for your use case, you can find out with a simple command:
php --ini
Once you've located the file you're looking for (ideally, one like xdebug.ini), this is what you should put into it:
zend_extension = xdebug
Next, to make use of XDebug, you need to enable it by at least establishing an execution mode:
xdebug.mode = develop,debug,trace
Now, restart your webserver, and you're ready to start debugging!
There's quite some nuance when it comes to XDebug's modes. If you want to learn more, read this article and watch this video.
Example: Configuring VSCode for XDebug
As I mentioned earlier, there are two sides to this process:
- The server
- The client
So far, you’ve learned how to install and configure the server, but if that's all you do, I'm afraid nothing will really change for you.
Any IDE can probably be used to debug PHP with XDebug, but since it’s free and popular, I'll use VSCode as an example.
If you don't have VSCode installed yet, you can get it here.
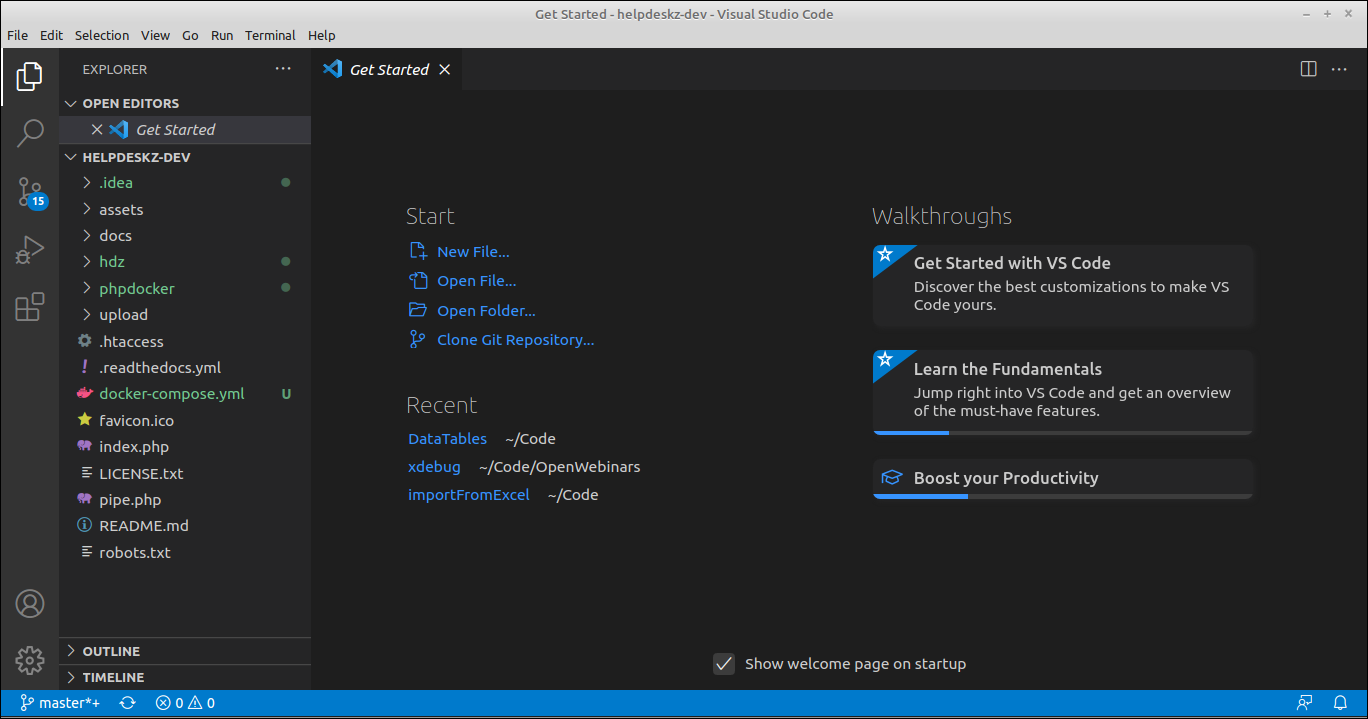
When you first start your IDE, you'll see a screen like this:
 .
.
If you click on the debug icon, you’ll see the following:
![]()
You'll also see a screen like this:
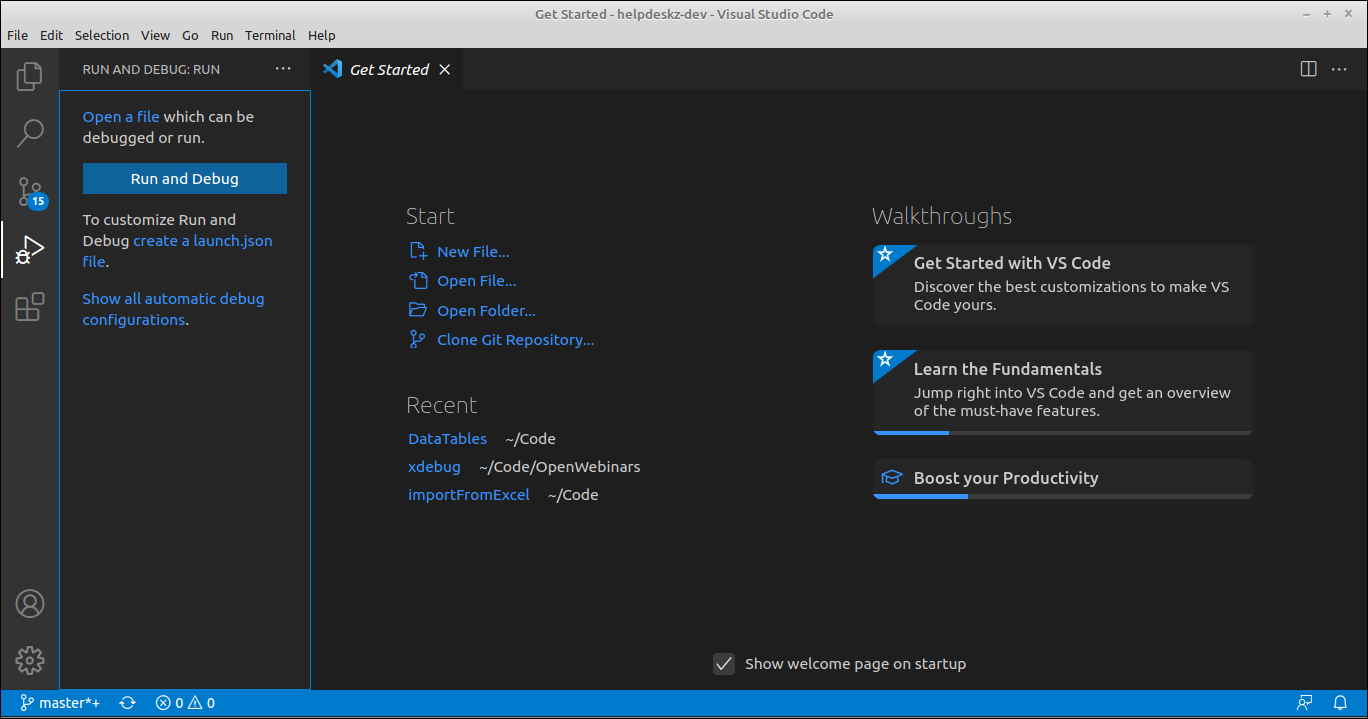
To start debugging, you’ll need to create a debug configuration. Click on "create a launch.json file" to start creating one. You'll see a dropdown similar to the following:
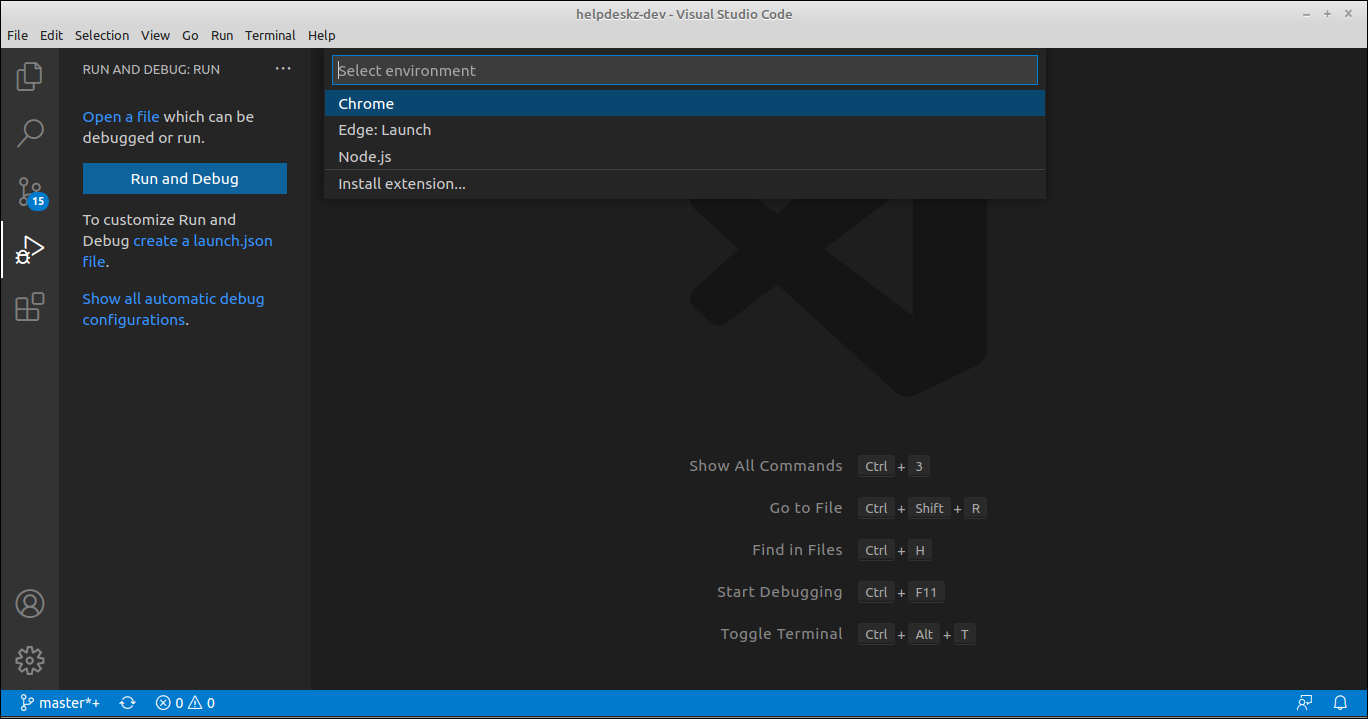
The best way to move forward at this time is to select "Install extension", where you'll be sent to a screen like this:
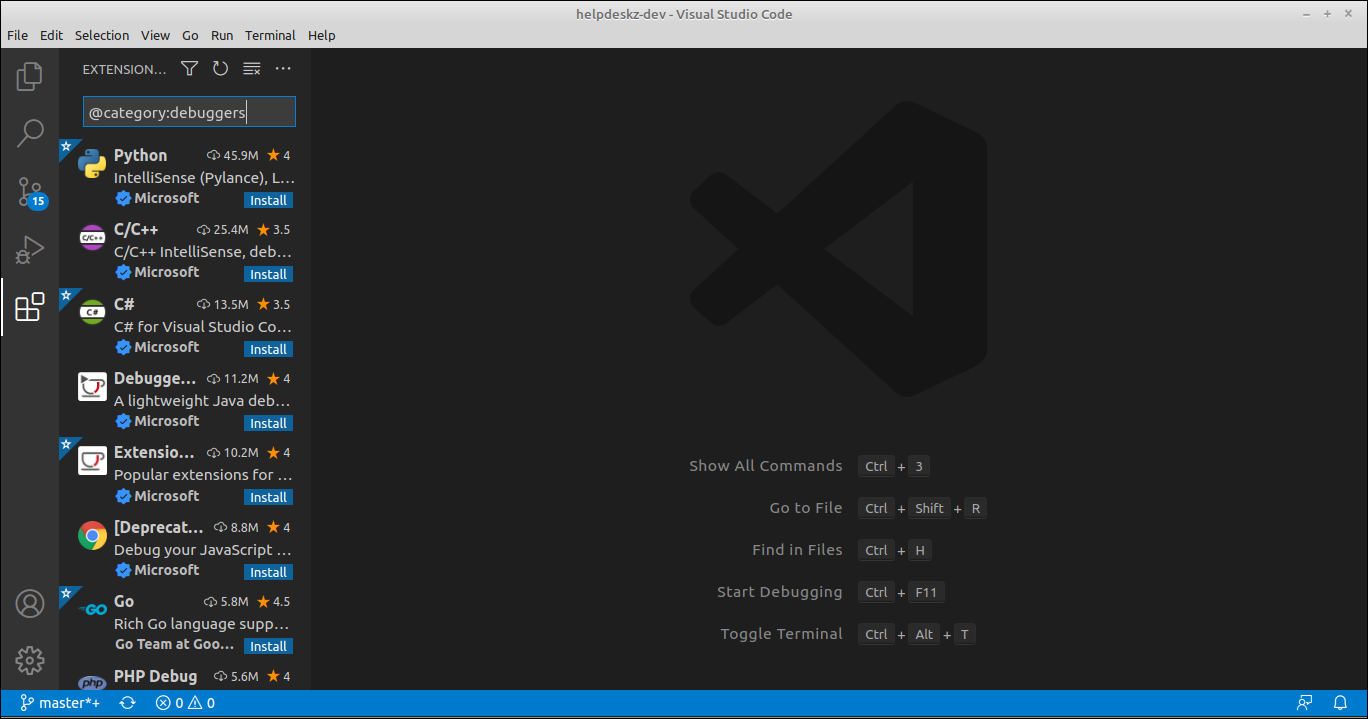
If you type php next to @category:debuggers, the option list will be reduced to only the plugins that apply to PHP development. There are still many options available. As a good rule of thumb, the most downloaded one is probably your best shot. In fact, the list is sorted by this criteria, so if you pick the first one, you'll be on the right track.
Click install:
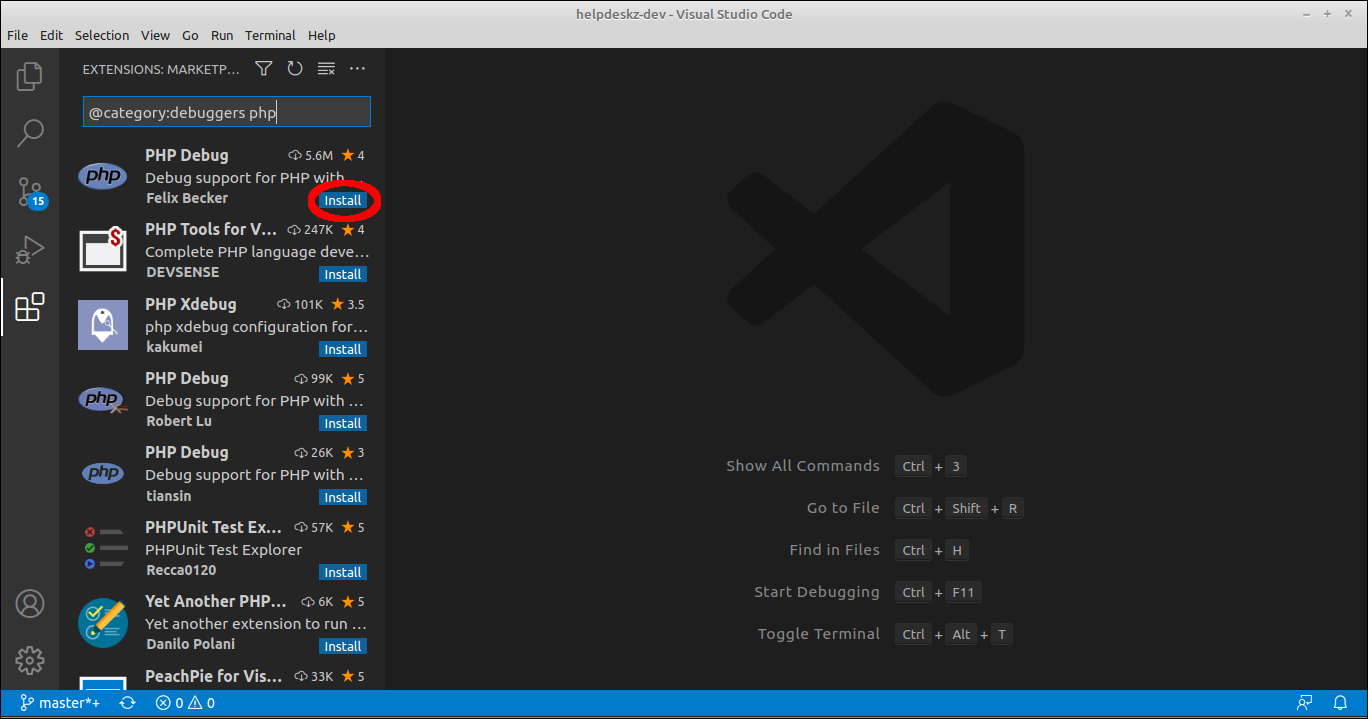
Once it's done, you'll see a screen similar to the following:
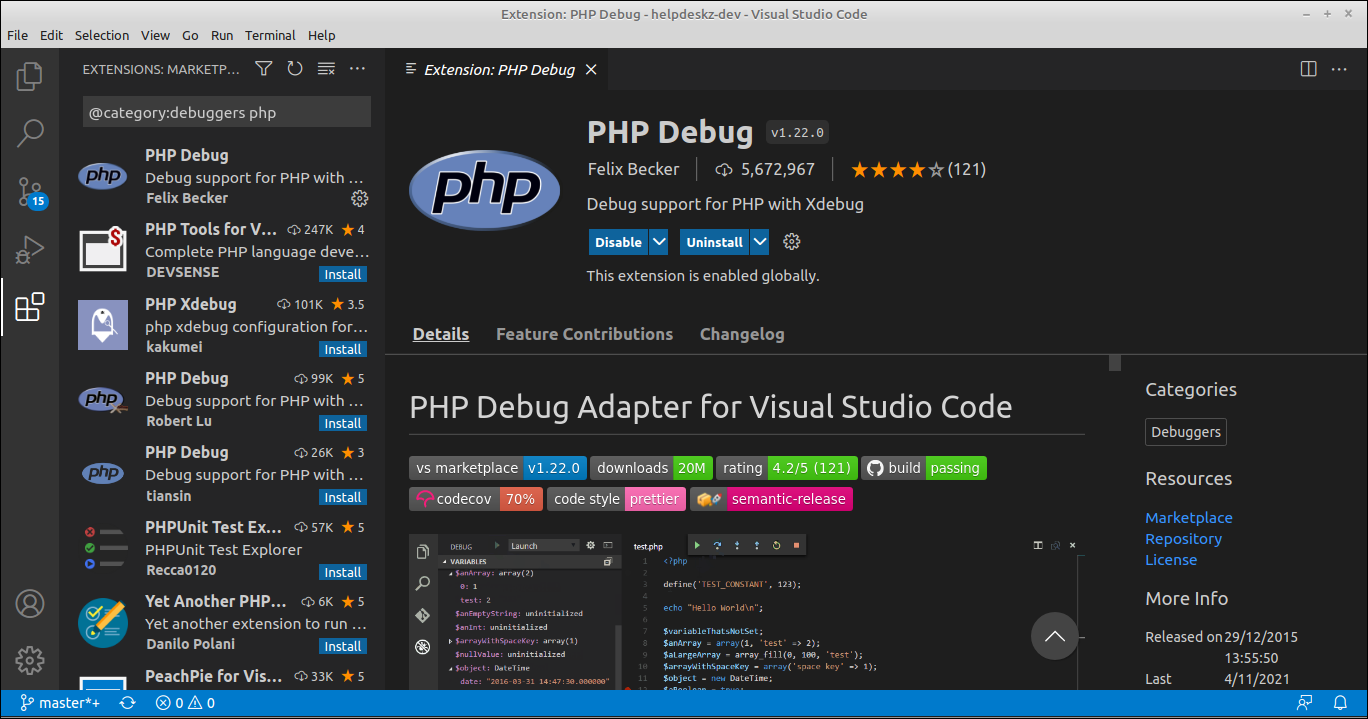
From there, you can see many details of the extension and some installation instructions for the server side.
Now, go back to the debugging screen, and once again click "create a launch.json file". You'll see the same pop-up, but this time, there's a new option available:

Select this option, and you'll be editing a file launch.json, which should look like this:
{
  // Use IntelliSense to learn about possible attributes.
  // Hover to view descriptions of existing attributes.
  // For more information, visit: https://go.microsoft.com/fwlink/?linkid=830387
  "version": "0.2.0",
  "configurations": [
    {
      "name": "Listen for Xdebug",
      "type": "php",
      "request": "launch",
      "port": 9003
    },
    {
      "name": "Launch currently open script",
      "type": "php",
      "request": "launch",
      "program": "${file}",
      "cwd": "${fileDirname}",
      "port": 0,
      "runtimeArgs": [
        "-dxdebug.start_with_request=yes"
      ],
      "env": {
        "XDEBUG_MODE": "debug,develop",
        "XDEBUG_CONFIG": "client_port=${port}"
      }
    },
    {
      "name": "Launch Built-in web server",
      "type": "php",
      "request": "launch",
      "runtimeArgs": [
        "-dxdebug.mode=debug",
        "-dxdebug.start_with_request=yes",
        "-S",
        "localhost:0"
      ],
      "program": "",
      "cwd": "${workspaceRoot}",
      "port": 9003,
      "serverReadyAction": {
        "pattern": "Development Server \\(http://localhost:([0-9]+)\\) started",
        "uriFormat": "http://localhost:%s",
        "action": "openExternally"
      }
    }
  ]
}
This configuration should be enough for now, but if you need more nuanced settings, you can always use the "Add Configuration..." button at the bottom right of this screen and make the changes you require.
Now that we've gone through XDebug's setup, let's see it in action.
Example Usages
In this section, you'll get to see two of the most typical usages of XDebug: debugging a web application and debugging a CLI application. For demonstration purposes, I'll be using the code located in this repository
Debugging a PHP Web Application with XDebug and VS Code
Start by going back to the debugging screen. At the top left, you'll see a dropdown "RUN AND DEBUG":
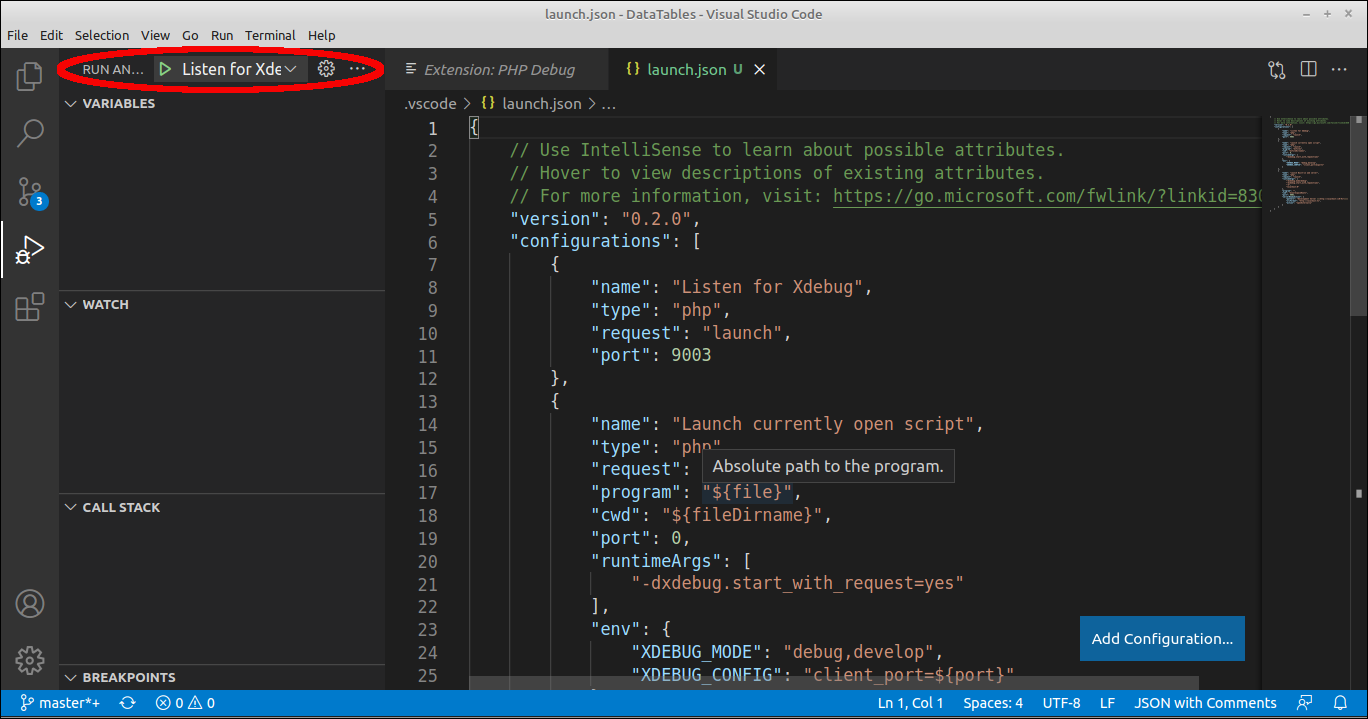
From there, select "Launch Built-in web server":
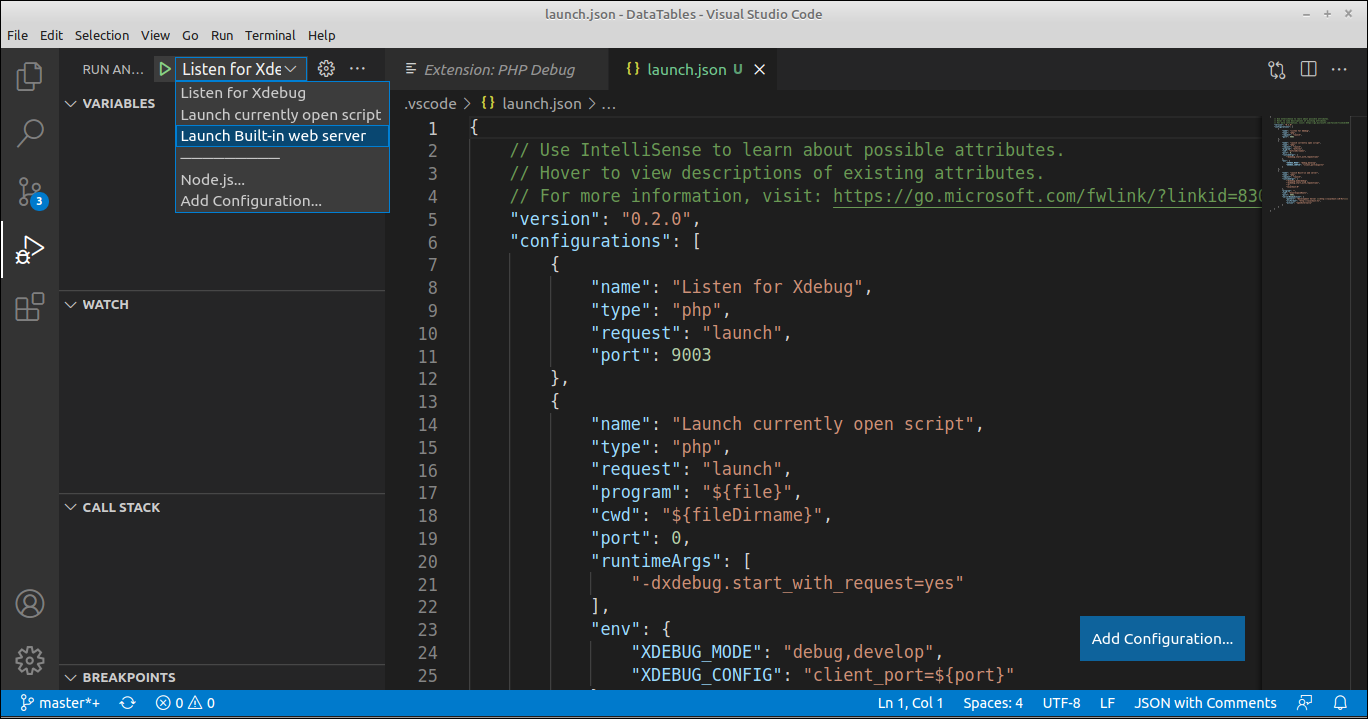
You'll immediately be taken to a browser. Not many surprises so far, right? Hold on. Things are about to get exciting.
Go back to VS Code and open the file get_data.php:
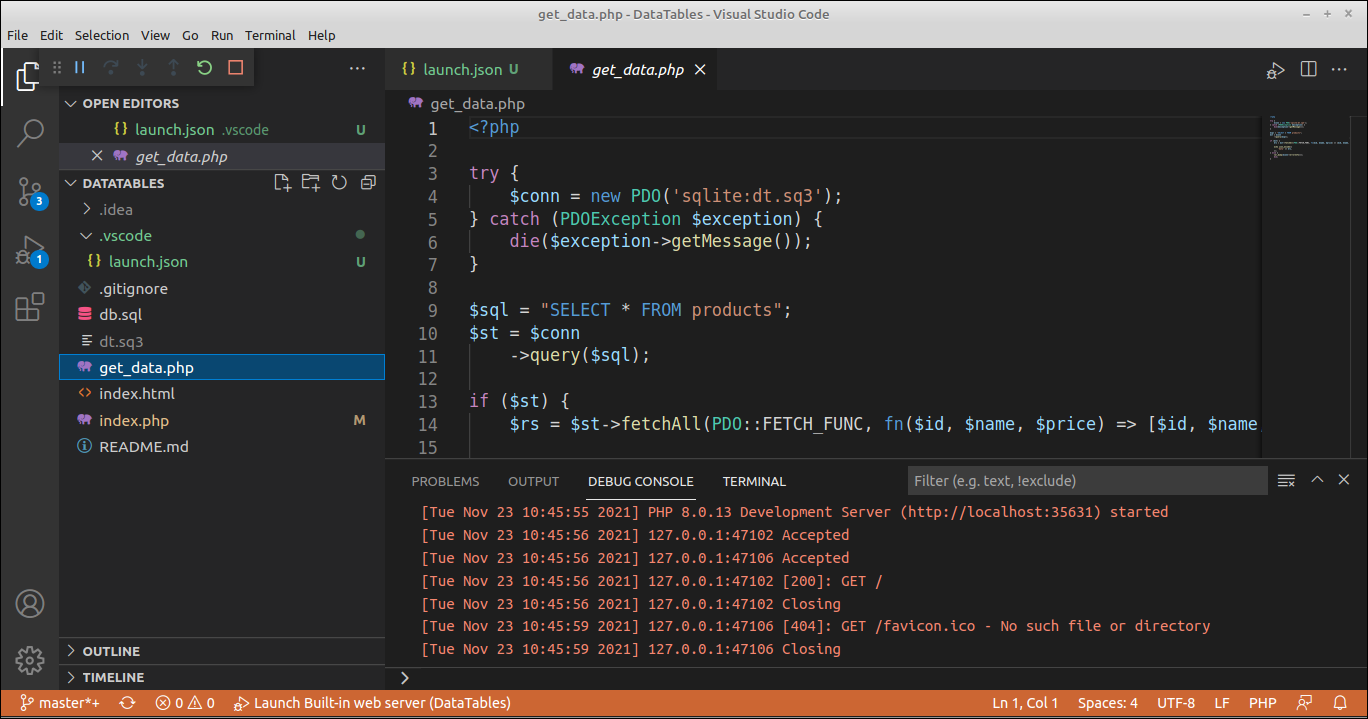
If you move your mouse right to the left of the line numbers, you'll see a small red circle appearing. Click on it at line 9:
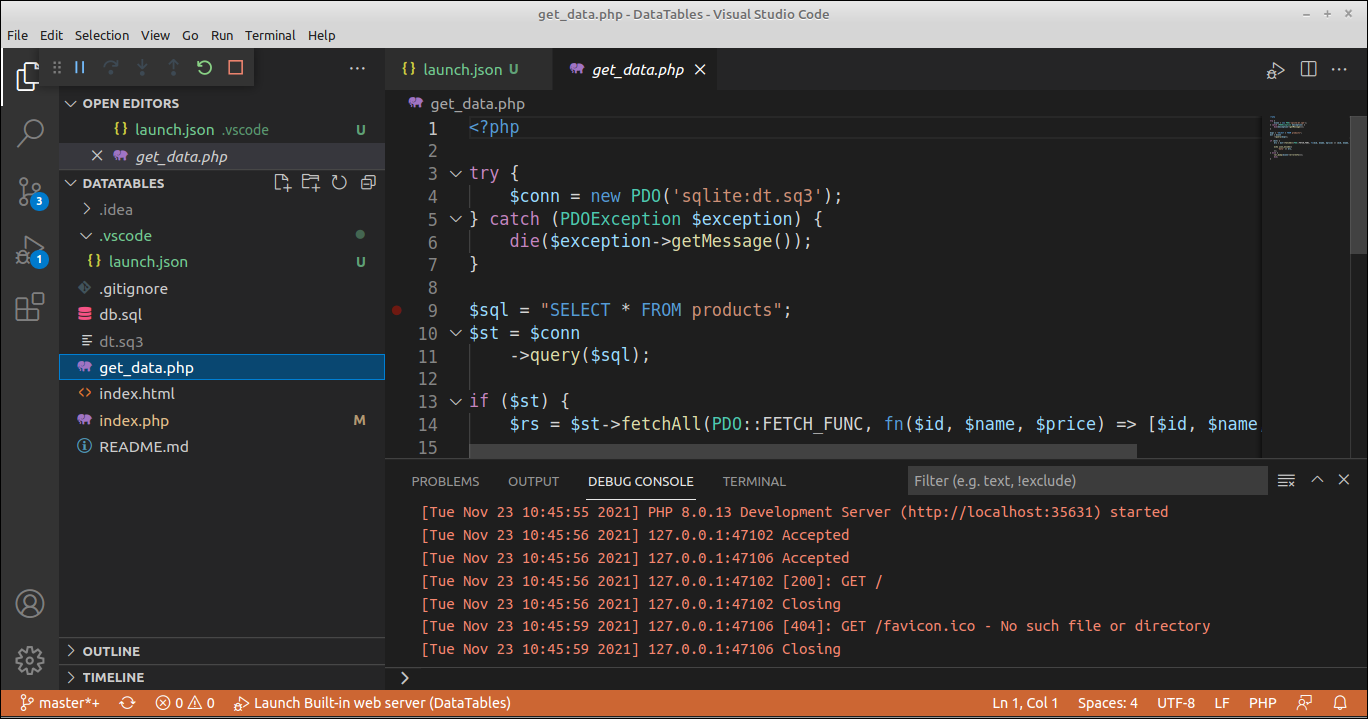
Congratulations. You just established your first breakpoint.
To check it out, go back to your browser and refresh the page. You'll be automatically sent back to your IDE, but this time, you'll find the following screen:
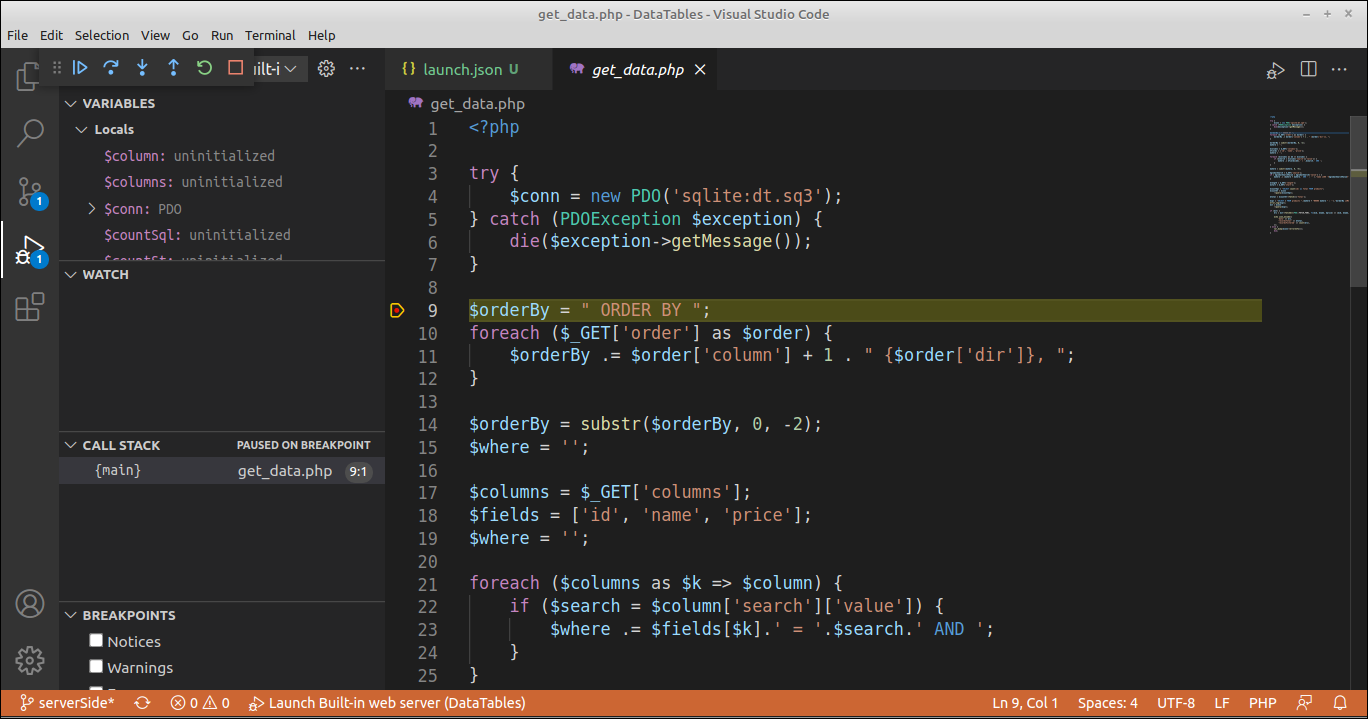
What happened? The script execution is on hold, waiting for your action. If you switch to your browser, you'll see that the screen isn't completely drawn. This is a consequence of the Ajax call not being finished. Now you can take all the time you need to examine what was going on at the server right before completing this request.
For instance, if you look at the top left panel (Variables), you'll see the values of every variable available to your script up to this point: after the execution of lines 1-8 but before the execution of line 9:
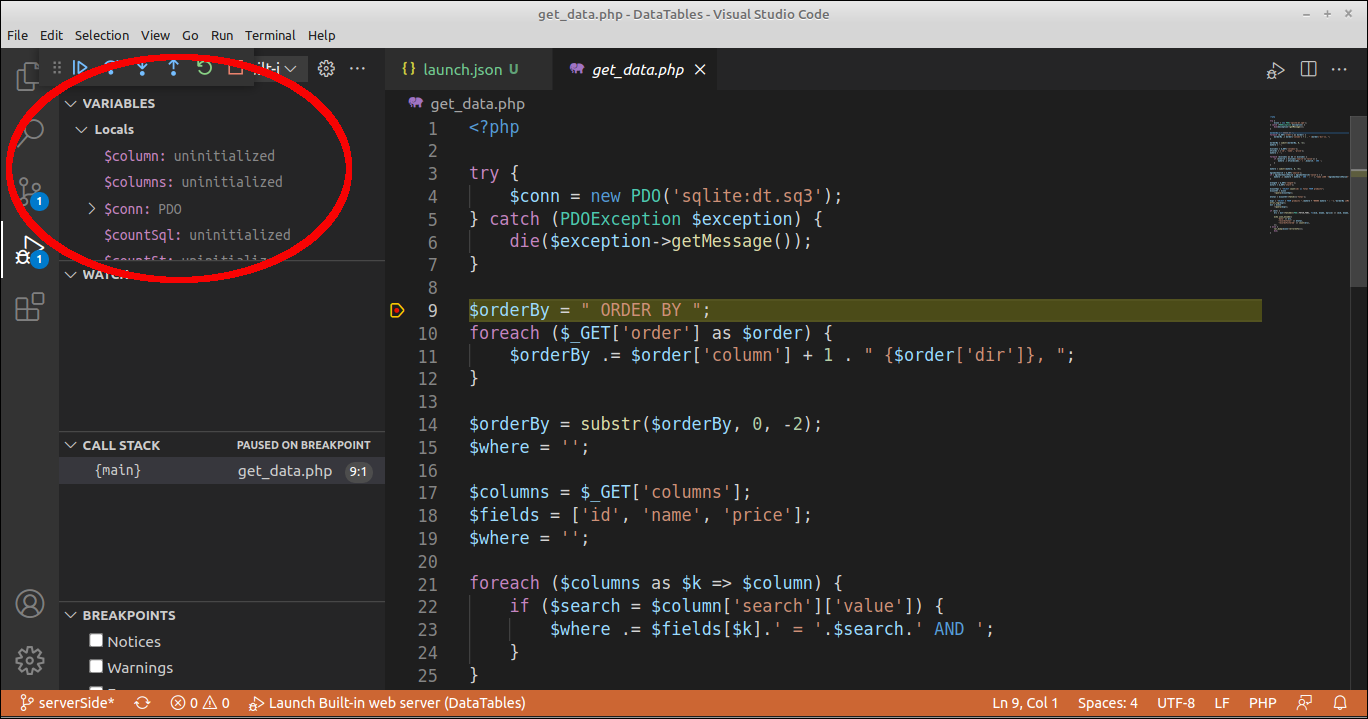
Right above it, you have a few buttons to continue the script execution as you see fit:
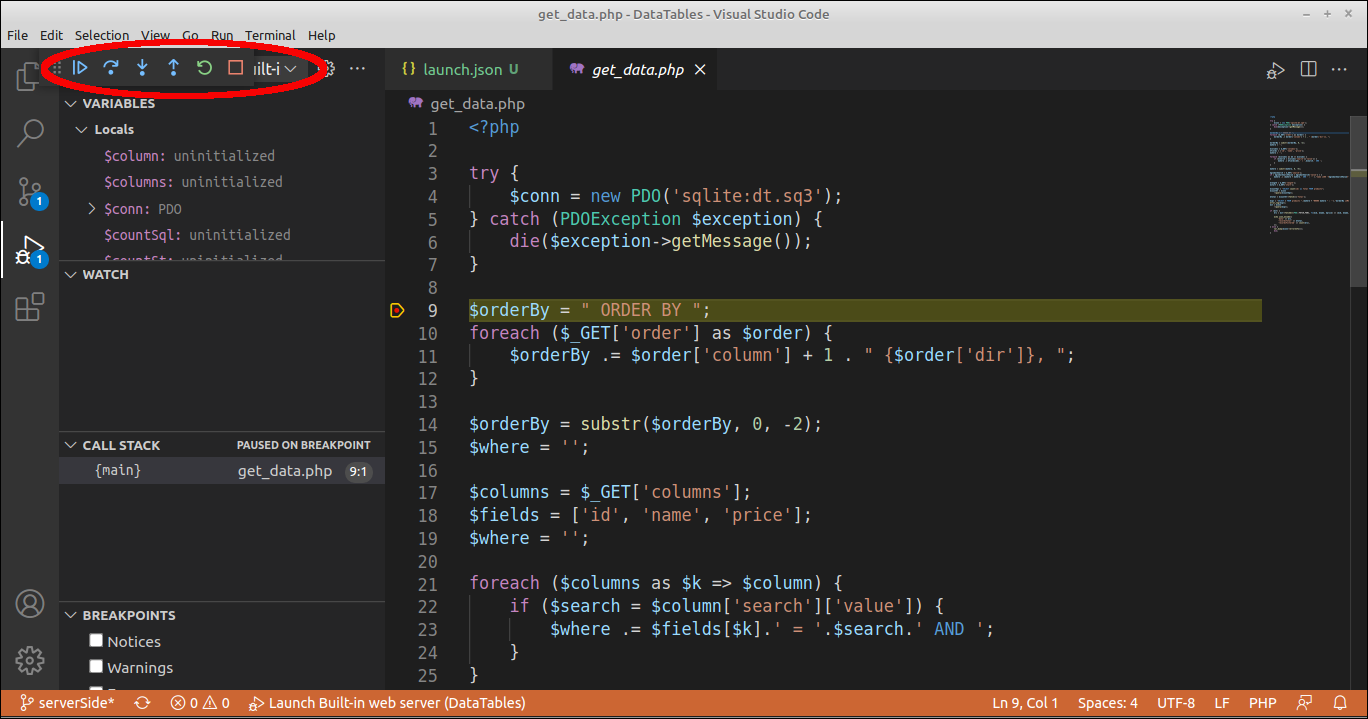
In particular, there three options available:
- Step Over
- Step Into
- Step Out
Using any of these, you'll be able to move the execution one step further, effectively allowing the step-by-step execution of the whole script. As you move forward, the variable values shown in the top left panel will be updated according to the dynamic flow of your program. This means no more var_dump all over the place unless you choose to do so.
Debugging a PHP CLI Application with XDebug and VS Code
When it comes to debugging a CLI application, things are really similar to what we just did.
Let's say you want to run get_data.php as a CLI script instead of through a web server. To properly debug it, all you need to change from the previously explored workflow is the debug configuration you'll be using.
Go to the debugging screen and select "Launch currently open script" from the configurations dropdown:
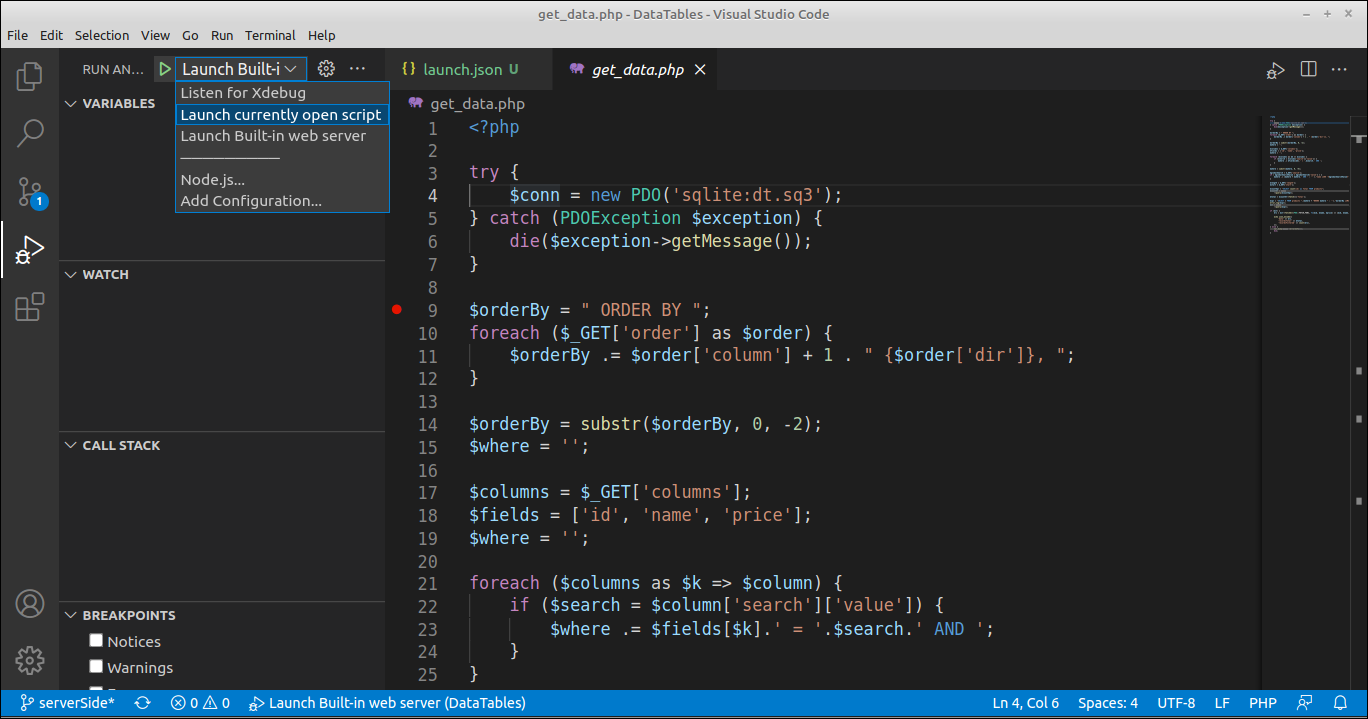
Then, if you hit the play button, you'll immediately see how the execution stopped at line 9. From there, you can keep it going at your own pace.
When running CLI applications, it's very common to have some parameters be fed to it via command line arguments. You can specify such arguments by adding an args key in the launch.json file, like this:
{
  "name": "Launch currently open script",
  "type": "php",
  "request": "launch",
  "program": "${file}",
  "cwd": "${fileDirname}",
  "port": 0,
  "runtimeArgs": [
    "-dxdebug.start_with_request=yes"
  ],
  "env": {
    "XDEBUG_MODE": "debug,develop",
    "XDEBUG_CONFIG": "client_port=${port}"
  },
  "args": [
    "argOne"
  ]
}
Similarly, you can add environment variable definitions via the env key. This could be a reason to have several launch configurations.
XDebug's Advanced Usages
So far, I've shown you the very basic usages of XDebug. In reality, it is a fairly complex and powerful tool. Before closing up, I'd like to take a moment to tell you about a few more advanced features you can take advantage of:
- Conditional breakpoints: the ability to break execution at a certain point in the code only if a condition is met. This condition is expressed as a simple PHP Boolean expression.
- Watches: real-time evaluation of complex expressions. You could think of the variables panel as the simplest form of watches.
- Profiling: execution time and bottlenecks analysis. This is such a broad topic that it should have its own article. I just wanted to mention it so that you know it's possible.
Conclusion
The old, dark days of using echo, var_dump, print_r and such for debugging purposes are over. For any PHP developers who want to take their craft seriously and reduce their bug-hunting time to the absolute minimum, there are great tools available.
The question is whether you will adopt one.


